Ace Interview Prep With AI

This article on interview prep with AI is part of the Content Collective series, featuring tips and expertise from Flatiron School Coaches. Every Flatiron School graduate receives up to 180 days of 1:1 career coaching with one of our professional coaches. This series is a glimpse of the expertise you can access during career coaching at Flatiron School.

My grandfather was known to say to his kids and grandkids when they received an invitation to interview for a job, “You get the interview. You get the job!” It was his enthusiastic way of communicating his confidence in our abilities. His belief, in part, meant that the hard work put into acquiring the interview (studying, relationship-building, practicing or honing our skills) would also serve us well performing in the interview itself. 

There’s no question that the job market has evolved quite a bit since my grandfather’s day. With the introduction of AI assistant tools like ChatGPT, preparing for interviews has become more efficient than ever. If used creatively alongside thoughtful and responsible editing and practice, the following approach can turbo-charge your confidence.

How To Use AI Assistant Tools For Interview Prep

If you’ve been on an interview for a job or been on a first date, you may recall how much preparation can go into such an event. From selecting the right outfit to finding the words to express why you’re interested without coming across as desperate, it can be a lot to think about. 

One of the most nerve-wracking parts is preparing to answer an interviewer’s questions that you can’t see ahead of time while weaving in your prior experience and how it will bring value to the organization.  

When it comes to interviewing for a job, AI assistant tools like ChatGPT can alleviate this prep work with key entries or “prompts,” a term (and even a new job category of “prompt engineer”) being promulgated by this new technology. 

Time to (role) Play!

Before diving into specific interview prompts, it’s helpful to view ChatGPT and other AI assistants like BingAI and Bard as just that – an assistant, or rather, a person. Give the assistant a specific role to play and give it as much information – or context – as it may need to play the role (that of an interviewer in this case) as accurately as possible. 

Context is critical in interviewing, whether you’re using AI to help you prepare or a real person like your Career Coach. A company is hiring you not to do just any job and not to solve just any problem. A good company has a very specific problem, has very specific jobs or responsibilities to tackle the problem, and if hiring, is looking for a specific person who has the right experience, skills, and adaptability to help solve the problem. 

Put It Into Action With AI

Enter the following prompt into the chatbot to give the AI assistant a role to play and as much context as possible to generate interview questions. 

Play the role of a <job title> for <insert company of your choice> (e.g., Spotify) who is hiring for a <insert job title> to join their team. The job description is <paste in the text from the job description on the company’s website>. What questions will you ask the candidate during the 45-minute interview to determine whether or not you will offer them a job to join your team? 

Watch as the AI assistant creates a list of questions that have remarkable relevancy to help you begin preparing for how best to respond.

Additional iterations:

  • In the same chat, enter the prompt “Now condense this list of questions to the top 5 questions.” 
  • If you have a LinkedIn profile of the hiring manager, try entering the text from the profile and regenerating the first prompt to give the chatbot even more context about the role it’s playing as a hiring manager. See if the questions change. What do you notice?

Now, what to do with those AI-generated questions?

With these questions in mind, it’s time to start creating what you might say in response. 

You can also use AI assistants like ChatGPT to generate some ideas. And, just like the example above, you’ll want to give ChatGPT as much context as possible to produce the most accurate “like you” types of responses.

Put into Action:

Enter the following prompt into the open chat you started above (i.e., do not start a new chat from scratch) to give the AI assistant a role to play and as much context as possible. 

Now play the role of an interview candidate who has been selected to interview for the same open position of <insert job title>. Your resume is <paste into the chatbot the text of your resume> (tip: use your LinkedIn profile if it contains even more details and experience). How would you answer <insert one question at a time from the list above> in 60 seconds? 

Watch as the AI assistant creates an answer using the inputs you gave it. What do you notice? Does it sound like your voice? Does it pull in the right experience? What’s missing from the answer it gives you? Should it be longer or shorter? 

Additional iterations:

  • Ask the chatbot to regenerate responses using the STAR method. 
  • Begin a new chat and ask the chatbot to create a 60-second introduction about yourself. Give it different scenarios in which you might introduce yourself (e.g., at the beginning of an interview, at an industry conference, or at a cocktail party). 
  • Use elements of the prompts above to create a follow-up thank you note to the interview that takes place, adding new information you gather from the interview itself (e.g., the questions actually asked of you and any other important or fun details from the interview you want to use to personalize your follow-up).

Rules of Thumb For Interview Prep With AI

When employing an AI assistant, it’s beneficial to follow a couple of key guidelines to achieve the best outcomes. Carefully read the output, maybe 2-3 times, and reflect on several introspective questions. 

Personalize & Contextualize

Does the AI-generated response sound like something I would say? Do the responses integrate the right context, accounting for nuances in my experience, and what I’ve learned about the company’s business, culture, and challenges? Not sure? Record yourself reading the response and listen back. What do you notice? What would you change? 

Be Honest

Do I fully understand the response it generated? Do I understand the terms and concepts enough to answer follow-up questions reasonably well? Not to worry if the answer is no. Being honest about your responses to these questions will provide a helpful list of topics to prepare yourself confidently for the interview. 

Practice and Seek Feedback

Now that you’ve got a solid starting point with your AI-generated questions, it’s time to put those responses into practice. Reading from a script is obvious. Not to mention, it defeats the point. Hiring managers are real people who are still hiring real people, even if AI tools are growing in acceptance in work environments. 

First, schedule an interview prep session with your Career Coach. Send them the job description ahead of time along with the questions ChatGPT gave you. Ask them to alter the wording of each question slightly, putting them into new words or in a different order.

Next, put away the responses to the questions from ChatGPT and practice responding in your own words. How does it feel? 

Keep practicing after your coaching session, recording your responses with tools like Loom or Riveter to listen and give yourself feedback. Send the recordings to your coach or a friend for additional feedback. 

The more practice we have relaying our experience and skills – hard and soft – to a variety of interview questions, the more comfortable we become when under pressure. Once you’re comfortable with 70% of the questions, practice the tougher questions at least a couple more times for good measure, and then take a break. Let your brain do work while you sleep, and rest easy(ier) knowing you’ve put in a solid effort preparing to ace your interview!

No job interview yet? No problem!

Repurpose the above prompts to fit prep work for an upcoming informational interview or networking conversation. Or, ask the chatbot to help you create an outreach message requesting an informational chat. 

In whichever scenario you choose to employ an AI assistant, remember that it’s merely a tool and those who use tools thoughtfully, responsibly, and creatively often create impressive results. 

About Lindsey Williams

Lindsey Williams is the Senior Manager of Coaching at Flatiron School. She has more than 15 years of experience in the tech and edtech spaces and has held a variety of roles from Recruiter and HR to Campus Director and Training Director.

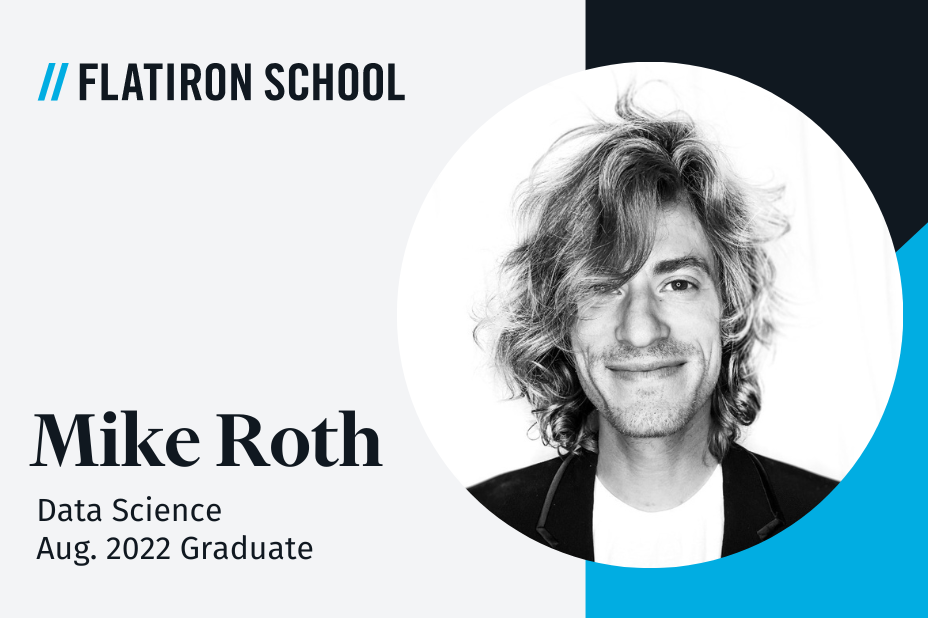
Mike Roth: Fine Arts to Data Science

Mike Roth, an August 2022 Data Science graduate from Flatiron School, began his career learning computer engineering before a love for creating pulled him towards a degree in fine arts. A decade later, however, he’s come full circle.

He shares his journey from the arts to Data Science below.

A Foundation In Fine Arts

Mike Roth has spent his career in the pursuit of creation. Initially beginning his education studying Computer Engineering, he ultimately graduated with a degree in Fine Arts. While many would question the transition between the two fields, Roth says that they overlapped at their core and differed only in the method of creation.

“I didn’t see much difference between the two [majors] since they are both highly creative fields, and I wanted to combine the two interests to take advantage of the power of coding in art.” 

Post-graduation, he used his combined skillset in a variety of positions including graphic design, web development, and marketing. But, a decade into his career, the financial pressures of living in a major city pushed him to consider a new career. 

“I was using my coding skills to create art and design, but I still struggled to make enough money to survive in New York with just a degree in Fine Arts,” he explained. “I’d designed graphics and websites my entire career and was looking for a new challenge.”

Roth didn’t have to look far to settle on his next path. He simply went back to the beginning – back to his enjoyment of coding.

“I love to code and wanted to pursue a career where I could code all day.”

His Bootcamp Experience

While looking into fields where his coding skills would be a valuable asset, Roth discovered Data Science and bootcamps. 

“Initially, Data Science seemed more interesting to me because it was one of the most challenging courses in a bootcamp,” he recalled. “Then I realized that I could do so much more with math and science on top of my software engineering skills.”

A referral from a friend spurred his interest in Flatiron School’s Data Science program

“I had an artist friend who graduated from Flatiron’s software engineering program a few years before me and has had a lot of success since. His experience made Flatiron one of my top choices for bootcamps. I wanted stability and progress in my career, and I knew from his experience it was achievable.”

Roth applied to Flatiron School’s full-time, 15-week Data Science course during the pandemic, but delayed his start date until in-person classes at the NYC Campus resumed.

“I really wanted to learn data science from people around me, not just online tutorials,” he explained. “Attending the bootcamp on campus was an amazing experience.”

He recalled how challenging the accelerated pace of the program was, but highlighted the support he received and the connections he made with those around him on campus. 

“The coursework is very demanding. Keeping up with every topic and project often required me to work late at night,” Roth said. “But my favorite part [of the bootcamp] was learning from my peers and professors, who would discuss complex math and neural network ideas.”

Job Search Experience

Mike Roth graduated from the Flatiron School Data Science program in August 2022. Unfortunately, his job search initially got off to a rocky start.

“I think because of my untraditional background I had trouble getting interviews. It was very difficult and disheartening at times.” 

But, throughout his job search, his dedicated Flatiron School career coach was there to keep him moving forward.

“My career coach was extremely helpful and supportive, and I owe all my interviewing and applying skills to him,” Roth said. “I called him my job therapist because while most of the job search work is on you, my career coach was there to back me up technically and emotionally.”

Despite the trying start to the search, Roth ultimately accepted a role as a Senior Consultant at GCOM Software. When we spoke with him in early 2023, he had only good things to say about his new career. 

“I love it! I didn’t know how much I would enjoy Data Science before I applied to Flatiron, but I really can’t get enough of it. I’d do personal science projects all day if I could, but I’m so happy to get paid for it and work with an amazing team of engineers and scientists. I can’t wait to see where my career leads.”

Reflecting On His Journey

Looking back at his journey from Flatiron School student to professional Data Scientist, Roth is particularly proud of the projects he completed while in bootcamp. Those projects, fittingly, combined his love of the arts with his new data skills. 

“In one project, I used informational entropy and neural networks to authenticate any artist’s work from fraudulent copies, specifically Bob Ross’ paintings. For my final project, I created a sound wave similarity search engine that uses data from Spotify’s API to find songs that are similar sounding. Try out a working demo here.”

Roth commented that he’d also learned to let go of societal notions around changing careers.

“My biggest takeaway from the bootcamp is that I’m not too old or unworthy to pursue a career change and that I can always expand my knowledge and experience, even if it seems different from my background.”

The fact that he’s come full circle is not lost on Roth either. 

“This was the path I had always been on to begin with; headed toward something challenging and new. I still have a bit of an imposter feeling about my math and science abilities, but I’m really excited to do this kind of work and I’m proud of what I’ve learned.”

His Advice For Other Students

Roth’s advice to others pivoting to a new career by way of Flatiron School is to lean into the uncertainty and inherent struggle in learning something new. 

“Don’t get too worried about whether you understand everything the first time. These concepts can be really difficult to understand or visualize the first time around, and take time to sink in.”

He also emphasizes the fact that, even after graduation, they should expect to continuously be improving and expanding their skillsets.

“I’m still constantly learning and feeling frustrated when I don’t understand something right off the bat, but I know it will come eventually. Work is work, but the work you put in always pays off – you learn more from your mistakes and difficulties than anything else.”

As for his love of creation, that passion is here to stay. 

“I’m working as a data scientist now, but I think I’ll always be an artist, no matter what my job is. Plus, at times Data Science can be more of an art than a science.”

Ready For A Change, Just Like Mike Roth?

Apply Now to join other career changers like Mike in a program that sets you apart from the competition. 

Not ready to apply? Try out our Free Data Science Prep Work and test-run the material we teach in the course. Or, review the Data Science Course Syllabus that will set you up for success and help launch your new career.

Read more stories about successful career changes on the Flatiron School blog.

Teacher Appreciation Week 2023

This Teacher Appreciation Week we are celebrating the people who help deliver our immersive programs: our curriculum designers, faculty managers, and instructors. Their hard work delivers the practical, applicable skills that help our students succeed.

In this post, we’re featuring several impactful members of the Flatiron School instruction and curriculum team – career changers themselves like many of our graduates – and revealing their advice to students.

Greg Damico: Technical Faculty Manager & Data Science Lecturer

Image of Greg Damico

Greg Damico, Technical Faculty Manager and Data Science Lecturer, began his career by spending more than twenty years in academia. He accumulated advanced degrees in Physics, Ancient Greek, Philosophy, and Applied Mathematics before ultimately pivoting into Data Science and teaching at Flatiron School.

Looking back at his career thus far, Greg is most proud of his impact on his students. 

“Maybe this is a little trite, but I’m very proud of helping to jump-start new careers. Watching students go from zero to hero never gets old.”

His advice for those students is to harness the power of collective learning. 

“Do not be shy about asking for help, especially from your peers! Two heads are better than one, and collaboration will be important wherever you go anyway.”

Jesse Pisel: Data Science Curriculum Manager

Image of Jesse Pisel

Jesse Pisel spent a decade in geology-related academic and industry positions before pivoting into tech, citing the desire for a quicker-paced work environment. He is now a Data Science Curriculum Manager at Flatiron School, pulling on his extensive experience to develop coursework for Data Science students. 

Jesse’s advice for students interested in pursuing data science is perhaps a result of his experience moving among different industries throughout his career.

“There are so many unique areas of data science to pursue. Getting a broad understanding of data science and all the different areas (statistics, machine learning, deep learning, visualizations, etc.) will help you identify what you find the most interesting. Once you know what you are interested in, you can then spend time deep diving into the topic to become an expert.”

Bani Phul-Anand: Lead Product Design Instructor

Image of Bani Phul-Anand

Bani Phul-Anand, Lead Instructor of Product Design, has more than 12 years of experience in the field. She began her career in luxury beauty and fashion, but a pivot into tech eventually led her to a career in Product Design and a teaching position at Flatiron School.

She advises students to continuously work at honing their skills throughout their careers, and lean into constructive feedback.

Practice more than you think you need to – that’s the only thing that will make you better at what you do. But don’t get stuck on tools or software, they change. And don’t be precious with your work – seek criticism, not validation.

Jeffrey Hinkle: Data Science Curriculum Writer

Image of Jeffrey Hinkle

Jeffrey Hinkle, a Junior Curriculum Writer for Data Science, spent more than two decades in the restaurant industry as a chef before pivoting into tech. The driving force behind his life change was the desire to spend more time with his family, and the work/life balance he now has as a Data scientist allows him to do just that.

His advice for students, and other career changers like him, is to lean into the struggle and embrace the learning journey. 

“Don’t give in to imposter syndrome, if you are uncomfortable with something you are doing or working on, you are expanding your knowledge. Staying in your comfort zone will not allow you to push yourself.”

Learn From The Best At Flatiron School

If you’re interested in seeing some of our instructors and curriculum managers in action, why not check out some of our past events? 

Exploring America’s Pastime with Bayes’ Theorem: Technical Faculty Manager Greg Damico explores the connection between Data Science and Baseball

Why Every Developer Should Learn Python: Senior Curriculum Manager Alvee Akand explains the importance of Python

Don’t Gamble on Your Cybersecurity: Cybersecurity Instructor Eric Keith talks about how cyber risks and modern gambling intersect

Playful Design – Exploring the Fun Side of UX: Director of Product Design Joshua Robinson discusses how we can use elements of fun in UX Design

If you’re ready to experience our curriculum and instructors firsthand, apply today.

Zachary Greenberg: Musician To Data Scientist

Zachary Greenberg, a May 2021 Data Science graduate from Flatiron School, spent a decade as a professional musician until the COVID pandemic made him rethink his career path. 

He shares his journey from professional musician to Data Scientist below.

Bit By The Music Bug

Zachary began his professional career by earning a bachelor’s degree in psychology with a specialization in statistics. It was during college however that he “was bit by the music bug”. 

“After graduation, I decided to pursue a singing career which led me to become a lead vocalist for theme parks and major cruise lines.” 

But, like many other artists, he was soon out of work when the 2020 pandemic heated up. He took time during the lockdown to evaluate the path he was on, ultimately deciding to make a career change to Data Science. 

“I was drawn to data science for 2 reasons. One, I already had a statistics background and was randomly learning Python in my spare time. Two, when I started getting more serious about it, I was amazed at the effect a data science project could have on people.”

His Bootcamp Experience

After researching bootcamps, Zachary applied to Flatiron School’s full-time, 15-week Data Science program. He cites the school’s reputation as a contributing factor to his decision to apply.

“I was particularly impressed by Flatiron’s word of mouth,” he recalled. “I was hoping that it would give me the tools and confidence I needed to enter the data science workforce.”

Zachary had previous experience coding before enrolling at Flatiron School. His twin brother – a Software Engineer – had taught him the basics as a hobby. But, once he reached the advanced concepts taught at the tail-end of the course, he recalls it being a challenge. 

“Making the switch from coding and statistics into machine learning [was hard]. It’s a very quick turn, but if you stick with it and lean on the support of your cohort you’ll come out successful.”

But once he made it through the advanced modules, he thoroughly enjoyed using everything he’d learned to create a capstone project. 

“It’s a passion project that not only shows you have the skills to see a project through from start to finish, but it also helps you to learn who you are as a data scientist and helps your audience to learn who you are as both a data scientist and a person.”

Working In Tech

Zachary graduated from Flatiron School in May 2021. He first interned at Sentara Healthcare before landing a full-time position with Guidehouse as a Data Scientist Consultant. Almost two years on from graduation, he is enjoying his new career.

“I am loving working in Data Science. I get to work with and learn from a great team of talented people every day,” he said. “I couldn’t ask for anything more than that. Reality absolutely lives up to the dream.”

Looking back on his journey, Zachary says he is “proud of the journey itself”.

“It’s crazy for me to think about where I am now from where I started. I’ve gained many new skills and made many valuable connections on this ongoing journey. It may be a little cliche, but it is that hard work pays off.”

As for his advice to other current or future Data Science students, he recommends looking at the big picture when things get hard.

“If you focus on your work’s impact on others, you’ll know exactly what you need to do to succeed.”

Ready For A Change, Just Like Zachary Greenberg?

Apply Now to join other career changers like Zachary in a program that’ll give you the tech skills you need to land a job in tech.

Not ready to apply? Try out our Free Data Science Prep Work and test-run the material we teach in the course. Read more stories about successful career changes on the Flatiron School blog.

March Madness Results: The Tale of A Busted Bracket

After 3 weeks and 67 games, March Madness ended with disappointment for most fans. While you may still be recovering from the gray-hair-inducing stress-fest that is the annual tournament (we recommend ripping up your paper bracket – it’s very cathartic), it’s a good time to look back at where we started and how things went so, very wrong for the official Flatiron School bracket. 

Our Machine Learning Bracket Prediction

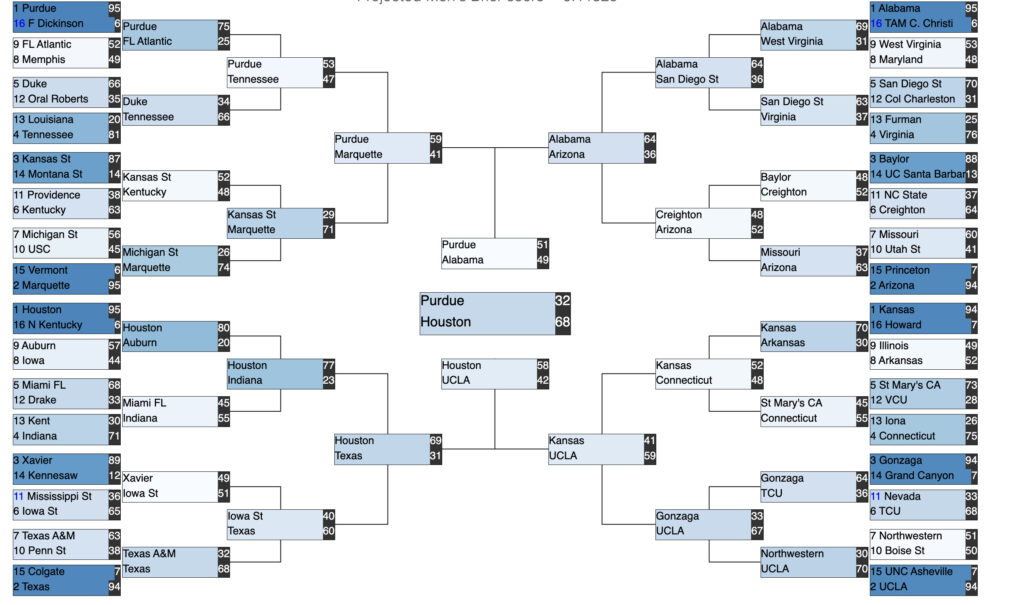
In March, Data Science Curriculum Developer Brendan Purdy used Machine Learning to develop a March Madness bracket, which you can see below. Visit this blog post to learn how he used Machine Learning to develop his March Madness bracket.

Machine Generated March Madness Bracket

Unfortunately, the Machine Learning generated bracket did not perform well. Purdy’s bracket correctly predicted only 2 of the final 8 teams and none of the final 4.

March Madness Results

This year’s bracket had quite a few surprises, with favorite teams like UCLA and Purdue not even making it to the final 8. And with San Diego beginning at a 25.7% win probability, it shocked many that they made it all the way to the National Championship.

NCAA March Madness Results

For a team-by-team breakdown of each defeat and unexpected upset, visit ESPN’s March Madness Results Pain Scale and be comforted by the fact that your agony is shared.

So, What Happened?

First off, let’s put some numbers into perspective around the March Madness Results. There are 9,223,372,036,854,775,808 possible outcomes for a bracket, so you’re more likely to win the lottery (or several lotteries) than guess a perfect bracket. And despite the more than 70 official brackets submitted each year, the longest (verifiable) streak of an NCAA men’s bracket ever was only 49 games, where the person predicted all of the teams who got into the Sweet 16 in 2022. 

So, whether Machine Learning and AI are used to generate a bracket or not, the odds are slim.

Machine Learning Constraints

Data Sets and Inputs

The algorithm uses certain assumptions to generate outputs based on provided inputs, and so makes predictions based on data trends. So, if team A has consistently beaten B, then there is a high probability that they’ll do it again, and that is what the AI will predict.

Where the training data is obtained from and the different weights they attribute to ranking factors such as historical seeding, performance (both season and postseason), box scores, geography, coaches, etc. can greatly impact the linear regression model’s predictions.

Preprocessing/ Feature Engineering

The preprocessing or feature engineering stage of creating a Machine Learning model is one of the most challenging steps. This requires bringing disparate data sets together, getting the variables in the proper form so that we can use the algorithm, and other cleaning of the data to focus the model on certain variables. 

Naturally, this can result in varied inputs and thus varied outputs. If fact, two Data Scientists given the same data set will inevitably preprocess it in slightly different ways, leading to distinct results. 

Dumb Luck

No matter how perfectly ranked your stats are, how precisely programmed the data set is, or the number of iterations your model runs, there are certain things a Machine Learning model won’t be able to account for. The model makes predictions based on previous data and past performance and predicts outcomes based on the same conditions. 

So if, for example, a star player is out of the game, the whole team got food poisoning the night before, or a hail mary shot somehow made it through the next in the last second of the game, the model does not expect nor account for random good or bad luck.

Conclusion

As fans can attest, there is no greater torment than watching your bracket inevitably go bust. And, while Machine Learning may increase your chances of hanging in longer, it’s almost inevitable that your bracket predictions will eventually prove incorrect. But if we’re honest, isn’t that half of the fun? From one busted bracket to another – better luck next year.  

Wanna try your hand at the Data Science fundamentals needed to make a Machine Learning model like the one discussed in this post? Try out our Free Data Science Prep Work – no strings attached.

How To Prepare For A Data Science Job Search While In Bootcamp

This article on how to prepare for a data science job search while attending a bootcamp is part of the Coaching Collective series, featuring tips and expertise from Flatiron School Career Coaches. Every Flatiron School graduate receives up to 180 days of 1:1 career coaching with one of our professional coaches. This series is a glimpse of the expertise you can access during career coaching at Flatiron School.

Deciding to change careers to Data Science and enrolling in a bootcamp is a major life step. Whether you are attending full-time or part-time, and continuing to work or not during your studies, it’s a big change to adjust to! So congrats on committing and pat yourself on the back for moving toward the life you want. 

But while you’re progressing through your studies, don’t forget to look ahead at what’s next – the job search. Don’t wait until graduation to start strategizing and working towards finding an opportunity! Instead, use the time and resources you have while attending your bootcamp to position yourself for success upon graduation. 

Here’s how to prepare for a Data Science job search while still attending a bootcamp.

Reflect On Your Strengths and Interests

In a bootcamp, you’re learning at an accelerated pace. New material is introduced each week, and the relentless pace is kept up for weeks to get you industry-ready in a fraction of the time of traditional educational paths. 

As you learn, take notes at the end of each week and reflect on the material and processes you use by asking yourself questions.

  • Which activities did you enjoy? 
  • What was challenging for you and what was easy for you?  
  • Do you like cleaning data? 
  • Do you like dealing with enormous masses of messy data points?
  • Do you like performing statistical analyses of data?  
  • Do you like conducting, testing, and maintaining architectures such as databases and large-scale data processing systems?

In addition to your experience with the technical “hard skills” associated with your discipline, think about any “soft skills” you’ve experienced as well.

  • Do you like creating dashboards for different types of audiences? 
  • How do you like managing projects? 
  • Would you like to be a liaison with other departments or work to understand clients’ needs?

Knowing your answer to these questions will inform what type of role you might enjoy once you’re working as a Data Scientist in the industry and your eventual data science job search.

Consider Your Career Direction

Once you have an idea of what you are good at and what you enjoy, begin considering where these skills and passions could best be used in the workforce. 

Talk To Instructors

Those that have walked the path before you are a great resource. Talk to your bootcamp instructors about how the skills and activities that you enjoy can translate to specific jobs. Their knowledge about the field is priceless, and when paired with their knowledge about you as a student, they may have some great recommendations.

Mine The Internet

Search online to find the different types of roles that are out there, such as Data Analyst, Data Scientist, Data Engineer, Business Analyst, Machine Learning Engineer, and more. While they may all deal with data, their day-to-day responsibilities can vary greatly.

For example, data analysts collect, process, and perform statistical analyses of data; while data scientists focus more on taking enormous masses of messy data points and using their skills in math, statistics, and programming to clean, massage, organize and model the data. While Data Engineers in many cases will develop, construct, test, and maintain architectures such as databases and large-scale data processing systems, data scientists pull relevant data sets from those databases for analysis. 

Read job descriptions, determine which role’s daily activities sound the most interesting, and make a short list of job titles that you’d like to pursue. 

Identify Skill Gaps

Once you’ve got an idea of which data-related jobs you might enjoy, it’s time to focus in on aligning your skill set. Look at job descriptions to see what skills are often required for these roles. That way, you can identify what you are strong at already and which you may need to develop further. Once you know what skills you would like to add to your toolbox, consider how you will obtain these skills, make a plan, and take action steps to obtain these skills.

Build A Targeted Portfolio

In your time at Flatiron School, you’ll have the opportunity to develop data-related projects based on a topic you pick yourself. But, before choosing a topic based on what others have done in the past, consider your interests and how you could highlight industries that interest you. Padding your portfolio with relevant projects can go a long way when interviewing potential employers. 

For example, let’s say that Samantha has a strong interest in making sure that all people have access to good healthcare and she would like to work in the healthcare industry after graduation. Samantha could complete a data project on the comparison of accessibility and lack of accessibility in the healthcare system and how these data points reflect an overall average age of death. Once she starts interviewing, Samantha’s project will demonstrate her data skills and her passion for the industry. 

Showcase the projects you create in your resume, cover letter, and in the “Featured” section of your Linkedin profile, and be prepared to discuss these projects and the steps taken to complete them during an interview.

Conclusion

There is always a ton of information to learn during a bootcamp. But, by being reflective throughout the process and taking action to set yourself up for success, once you graduate you’ll be better prepared for your job search. After all, knowing what type of role you want is half the battle.

About Laura Nicolaisen

Laura Nicolaisen is a Career Coach with Flatiron School. She has 15-plus years of experience as a career coach collaborating with recent graduates, professionals, and executives. In addition, Laura has over 15 years of experience working in the university and bootcamp setting, in such areas as admissions, student advising, coaching, and as an executive team member.

Making March Madness Predictions With Data Science

For millions of Americans, the third month of the year means only one thing – March Madness. With more than 70 million official brackets created annually, the likelihood of your bracket being correct is slim.

Here’s Data Science Curriculum Developer Brendan Purdy on how he uses Machine Learning to make predictions and beat the odds.

The Tournament

First things first, we’ll do a short overview of what the March Madness tournament is for those not familiar with all things Basketball, or who just need a refresher. 

The NCAA Division I men’s basketball tournament is a single-elimination tournament of 68 teams that compete in seven rounds for the national championship. The playoff tournament is known as “March Madness” due to there being 67 games in the single-elimination tournament within three weeks, many of which overlap and are played simultaneously in the beginning. The winner of the tournament is crowned the NCAA Basketball Champion for the season.

Creating Brackets

Individuals pick who they think will win each game. Millions of fans submit their brackets for online competitions that have payoffs. Over 40 million people fill in brackets, many people more than one, which results in over 70 million officially submitted brackets. The actual number of brackets created each year is likely much higher, considering that many will simply make their own and never share or submit publicly. 

To complicate matters, there is a “Round 0” of the tournament called the “First Four” where 8 teams play for four spots in Round 1. Round 1 has 64 teams.

The process of creating a bracket is to select the team you think will win each match-up. As the tournament proceeds, your choices narrow down until the championship game. 

This article will cover the men’s tournament, however, two March Madness tournaments run simultaneously – a men’s and a women’s. Everything that’s covered in this piece data-science-wise can be applied to both.

By the numbers:

  • 9.2 quintillion – With 63 games from Round 0 on, there are 2^63 = 9,223,372,036,854,775,808 possible outcomes for a bracket
  • 49 – The longest (verifiable) streak of an NCAA men’s bracket is 49 games, where the person predicted all of the teams who got into the Sweet 16 in 2022
  • $3.1 billion – About 45 million Americans wagered a total of 3.1 billion dollars on March Madness games in 2022

With billions of dollars wagered each year on statistically slim odds of winning, why not use Data Science to make better predictions?

Data Science

The goal of Data Science is to discover actionable insights hidden in large data sets by creating models using the tools of mathematics and statistics and machine learning, along with germane subject matter expertise.

Let’s break those ingredients down a bit more to see how they all work together to make predictions.

  • Mathematics and statistics – Math and stats give the foundations of machine learning algorithms and inform us how we can interpret the models.
  • Machine learning – Machine learning is artificial intelligence algorithms that learn from data.
  • SME – The data is always about a specific thing, and this is where the subject matter expertise (SME) is germane. Having SME aids you in accurately interpreting data to produce relevant insights.

Now, what skills will you need to create a powerful predictive model to beat the March Madness bracket odds? The main fundamentals the typical data scientist would use to create a model like this one are:

  • Math and stats – Calculus, Linear Algebra, Statistics, Probability
  • Programming/software skills – Python, Tableau, SQL, R/R Studio
  • Other skills – SME, Communicating and storytelling with data, Data ethics, and privacy

If you don’t have all of those skills – worry not! You can still read about how the modeling works using machine learning below, courtesy of Flation School Data Science Curriculum Developer, Brendan Purdy. Or if you want to try your hand at Data Science, jump into our Free Data Science Prep Work!

Machine Learning

Next, we’ll learn a bit about Machine Learning – how it works, its goals, and common examples. 

Machine Learning is often defined as “a subfield of Artificial Intelligence where the algorithms learn from data.” That’s the key – that the algorithm learns from data, instead of just delivering preset and easily-definable outputs as a calculator does. For example, programmers initially programmed AI to play games like checkers and chess and inputted all the rules so that if an opponent did an action, the program would perform an expected response action. However, with modern AI, the system has enough computational power to learn from the data and perform new, nonprogrammed actions, making it machine learning

Types of Machine Learning

There are two main types of machine learning – supervised and unsupervised. 

In supervised machine learning, algorithms are trained using labeled data, e.g. linear models, nearest neighbors, decision trees, and gradient-boosting decision trees. The programmer tells the AI what the data means, and then asks the AI to look at similar data and determine what it is. For example, define an image as a picture of a cat, then show another image and ask the AI if the image is of a cat or not.

In unsupervised machine learning, algorithms are used against data that is not labeled, e.g. Gaussian mixture models, and clustering algorithms. For example, give the AI pictures of various animals, and ask how the machine would group them.

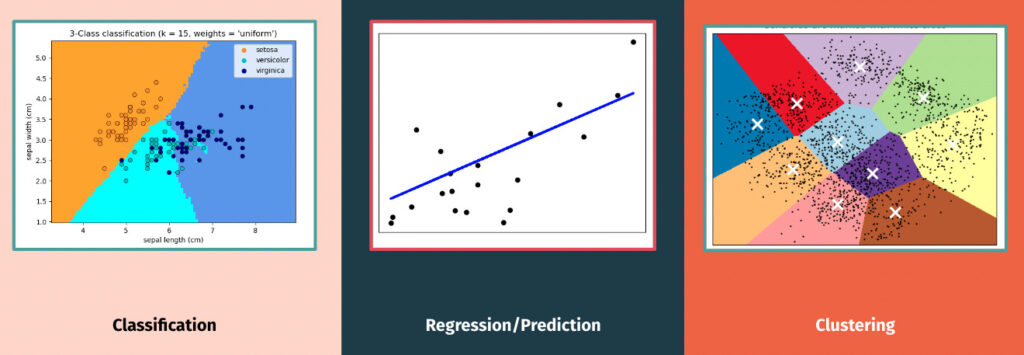
Common Goals of Machine Learning

Three Common Goals of Machine Learning

Classification – a type of supervised learning. In this type of program, you give the program attributes to group items based on.

Regression/Prediction – a type of supervised learning. This is the type of model that we will use to create our March Madness Bracket. The most basic example of this is our linear regression model, with a line that represents trends in the data. 

Clustering – a type of unsupervised learning. In this case, the machine puts data into clusters. This model type is used to make inferences from demographic data for companies. For example, if you are part of a rewards program, these types of models gather data based on your purchases, then use clustering machine learning to attribute you to a certain demographic and inform targeted advertising campaigns.

Machine Learning Usage In Industry

Whether you realize it or not, machine learning permeates much of your daily life. According to industry surveys, 67% of companies were using machine learning in 2020. 97% planned to use it in 2021. 

Some examples of machine learning that you likely interface with, or interfaces with you and your data, almost every day:

  • Recommendation systems (Netflix, Amazon)
  • Neural Networks (sports analytics)
  • CNN (medical image analysis)
  • NLP (Translations, Chatbots)
  • Clustering models (demographics of customers)

The applications for machine learning are numerous and growing each year. Knowing how to wield such a powerful tool can set you up for success in far more than just your friend’s March Madness bracket. 

Extreme Gradient Boosting

Now that we know a bit more about machine learning, which algorithm are we going to use for our bracket predictions? For making a March Madness prediction, we will be using a decision tree.

Decision Trees are a supervised learning method. The goal is to create a model that predicts the value of a target variable by learning simple decision rules inferred from the data. They can be used for classification or prediction.

A decision tree takes in data and determines the probability of the most likely outcome. 

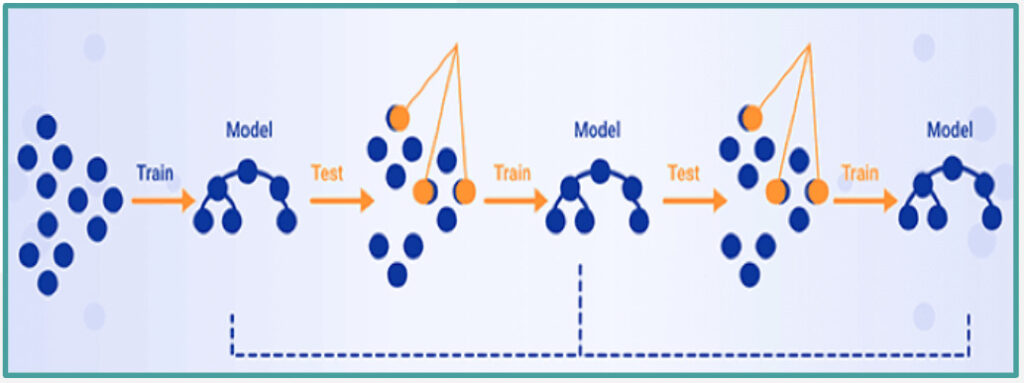
For the specific decision tree type, we will be using a Gradient Boosting Decision Tree (GBDT). A GBDT uses boosting to create many decision trees iteratively. It uses weak learning to calculate the gradient to minimize the error for each iteration of the algorithm. The model makes the prediction based on a weighted aggregation of each input. The algorithm also calculates a gradient to minimize errors for each iteration. 

Gradient Boosting Decision Tree

How Boosting Decision Trees Work

Some facts about Boosting Decision Trees to further explain how the model works:

  • Ensemble Method – In machine learning, an ensemble method combines more than one technique. Boosting is a type of ensemble learning that uses many decision trees. Ensembles often work better than a singular model as they’re able to exploit multiple algorithms at the same time.
  • Weak Learner – A weak learner is a model that only does slightly better than random chance. This results in a simple decision tree. 
  • Iterative – One tree is created and then the algorithm determines what the weak learner got wrong. It then builds another weak learner that focuses on what the previous tree got wrong. This process continues until a stopping condition has been met.
  • Aggregate Predictions – Boosting algorithms make the final prediction based on a weighted aggregation of each input. The inputs that were harder for the weak learners to learn are weighted higher than those that were easy to learn. 

Minimizing Errors

As mentioned above, gradient boosting is used to minimize the errors in each iteration created. Here’s how the model does this:

  • Residual Fitting – A residual is how far the actual value is from the predicted value. GBDT uses the residuals with a loss function to see how well, or poorly, it is doing.
  • Loss Function – A loss function uses the residuals of the model to calculate the overall loss. (The loss function must be differentiable.)
  • Gradient Descent – The gradient is a concept from calculus that is used in a myriad of machine learning models. The key idea of the gradient descent is that it uses the second derivative of the loss function to determine how to minimize loss, i.e. error. This is what GBDT is using at each iteration of its algorithm.

All three of these concepts tie together. The residual fitting is the input into the function. The loss function is the function itself, and the gradient descent is the second derivative of the function.

XGBoost & Bracket Prediction

So how do we implement this Gradient Boosting Decision Tree to make March Madness predictions? By using XG Boost.

Data Set

Everything starts with acquiring data. The NCAA and Kaggle release several data sets that contain for each team: historical seeding, performance (both season and postseason), box scores, geography, coaches, etc. Five thirty eight and other websites also have a ranking of the teams.

Preprocessing/ Feature Engineering

This is often the most challenging aspect of machine learning: bringing disparate data sets together, getting the variables in the proper form so that we can use the algorithm, etc. 

Preprocessing is prepping the data, and feature engineering is focusing on certain variables. Once this is complete, you move on to XG boost. 

XG Boost

XGBoost is the most commonly used library for GBDT and is available in a large number of languages, including Python. Part of where the science of data science comes in is at this point when the data scientist needs to “tune” the model. If two data scientists used the same data sets and did the same preprocessing and feature engineering, modifying the model’s parameters (aka “tuning” it) differently will result in different outputs. 

Predictions

In a single-elimination tournament with 68 teams, we predict (68*67)/2 = 2,278 matchups and get the probability of who is more likely to win each possible match-up.

Sample Output

The predictions represent the probability that the team with the lower id will beat the team with the higher id, e.g. 1101 has a 2.7% chance of beating 1104.

Measuring Success

So once you have your bracket, how do you measure success? We’ll consider two ways how well we did.

Bracket Challenges

For sites like CBS Sports, ESPN, etc., typically a weighted value is given for each game where you have a correct pick, e.g. 1st round is 1 pt, 2nd is 2 pts, Sweet 16 is 4 pts, Elite 8 is 8 pts, Final 4 is 16 points, Championship is 32 pts. The highest score at the end is considered the “winner.”

Machine Learning Competitions

For ML competitions like Kaggle where the goal is to use ML modeling, then a metric like log-loss is used. Log-loss is indicative of how close the prediction probability is to the corresponding actual value (win or loss). In particular, this provides extreme penalties for being both confident and wrong.

Brendan Purdy’s Bracket Predictions

March Madness Bracket

Here’s Brendan’s March Madness bracket, based on his Machine Learning model (though he notes, as a long-time UCLA fan, that he does not approve of Houston beating UCLA, no matter what the algorithm data says.)

Come back in mid-April to see how he did, with a follow-up piece explaining model predictions vs. real-life results.

Major League Baseball and Machine Learning | Data Science Student Project

Eric Au, an August 2022 Data Science graduate from Flatiron School, combined his love of sports and machine learning to create his capstone project. 

In his project “Stepping Up To The Plate”, Eric used machine learning to predict MLB player salaries and team wins. Watch his full presentation below:

Stepping up to the Plate – Major League Baseball and Machine Learning by Eric Au

If you’re a sports fan or a fan of the movie Moneyball, you know that an issue teams face is how they spend and allocate money when it comes to building a team.

The core subject in Moneyball was how smaller market teams such as the Oakland Athletics can compete with larger market teams like New York and Boston who can spend much more money. For my capstone project, I wanted to explore that and try to predict the MLB player salary of pitchers and batters using historical baseball data. Secondly, I wanted to better understand what statistics contributed the most to winning when it comes down to predicting team wins.

Data Set

The data set for this project consisted of historical baseball statistics and advanced statistics. 

In 2014 Major League Baseball introduced Stat Cast which allowed teams to collect more baseball data than ever before. This included detailed statistics such as how hard the ball was hit, how many revolutions per minute the ball spun, and many others.

The key takeaway here is that advanced statistics have far more features or variables to work with. 

Taking a look at the data set that I worked with, we see some of the highest-paid players in baseball. This gives you a good perspective of some of the top Echelon of stars in the game as of 2021, as some of the top players are making in the tens of millions of dollars. I considered most of these players as outliers.

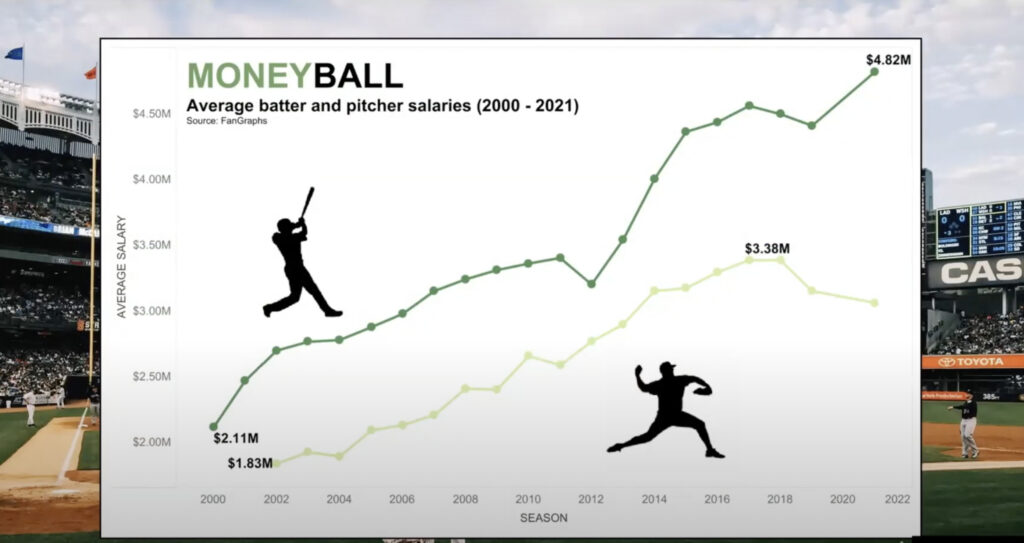
However, since 2000 I noticed that the average batter and pitcher make far less than the outlier group. Batters are more recently making about $5 million on average compared to the pitcher making about a million less.

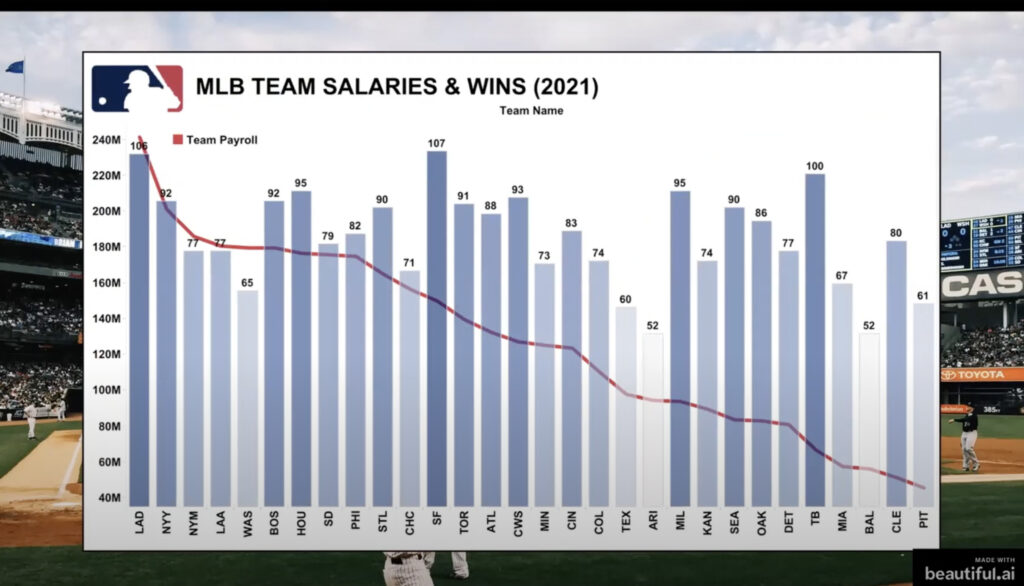
As I mentioned Major League Baseball has incorporated data analytics more. When taking a look at team salaries and wins during the 2021 season we can discern some noticeable observations. We especially see data analytics used heavily for teams like the Tampa Bay Rays who are on the far right with 100 wins and the Milwaukee Brewers directly adjacent to that with 95 wins. 

Ultimately these are two example teams that have a smaller relative payroll than some of the bigger M\market teams like the LA Dodgers or the New York Yankees.

Predictive Results

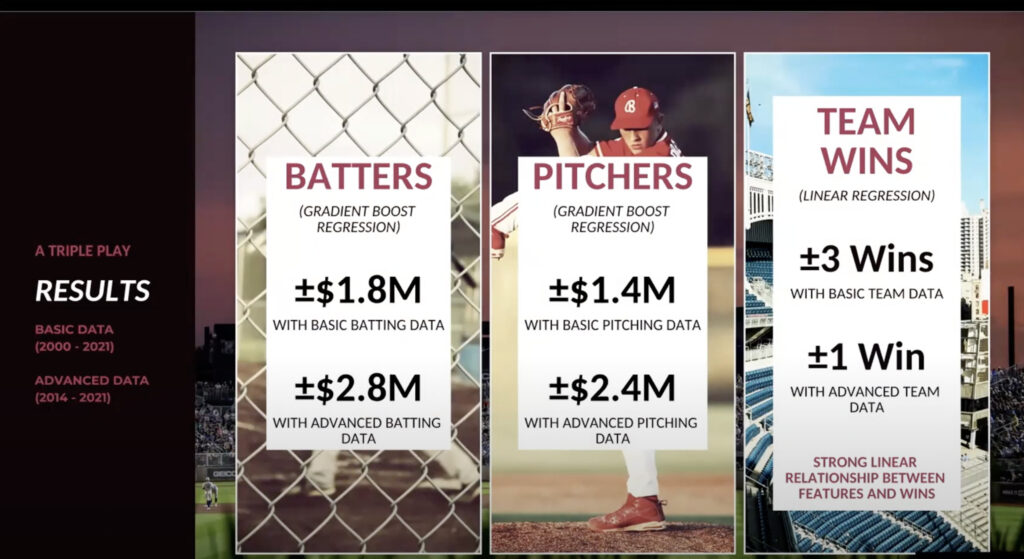
In terms of results for my predictive model, I achieved a margin of error of under $2 million. For Advanced Data the margin of error was about $2.8 million and $2.4 million for batters and pitchers respectively. The reason for the different margins of error is due to the different sizes of the data sets. When predicting team wins per season this was a fairly simple linear regression model where I was able to achieve a margin of error of one win using Advanced team data. This indicates that there’s a strong relationship between features and wins.

Model Web Application

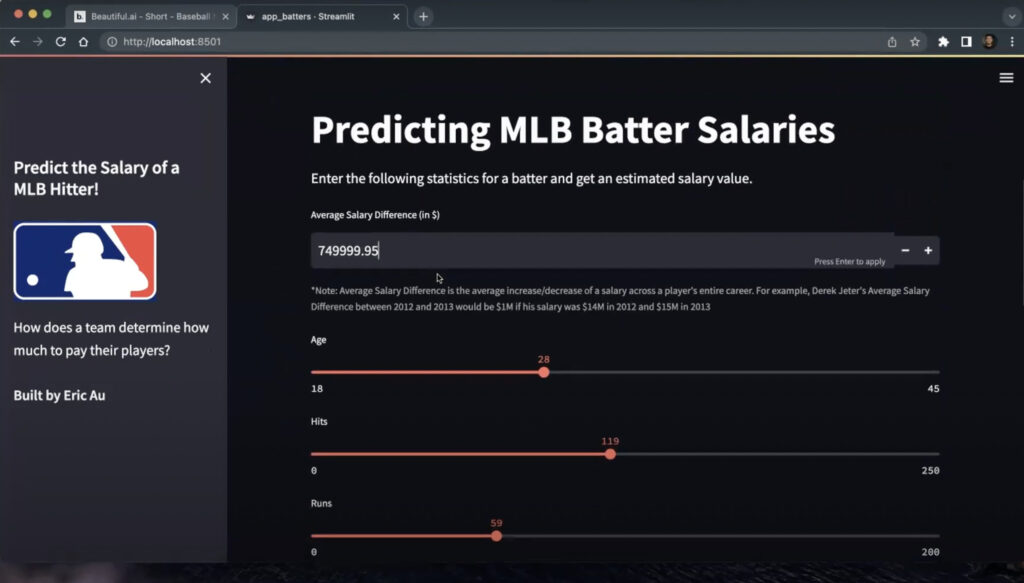
I also want to show this application that I made. I used streamlit to develop a pair of locally run applications. They take in user input and provide a salary prediction for pitchers and batters. 

For example, this first input is $750,000, which is the average salary difference across a player’s career. This gives you a little of how that was feature engineered. Ultimately, you can shift around some of these values for batters. You can do whatever you want, you can make whatever player you’d like to make for this previous season. Then, hit submit and it gives you a predicted player salary of $3.8 million.

Hopefully, you can afford that if you’re building your team.

Comparing Model To Season Statistics

Another thing I looked at while working on this project was how it compares to this season’s statistics and how much money players this year might be making as of August 24th, which is when I loaded this data set. If you’re familiar with the game of baseball, one player that’s doing exceptionally well this year is Aaron Judge. He plays for the New York Yankees. He’s recently made $90 million this year; my model is predicting he makes $21 million as of August 24th. One could argue that’s still underpaid. But based on the season statistics alone you’ll know if a player is overvalued or undervalued.

Technology Used

In terms of the technologies that I was using, the main language was Python. It Incorporated the scikit-learn library to apply those machine learning techniques for this project. Visualizations were developed using Tableau Software and the web application was deployed through streamlit. All the data was sourced using the pybaseball library and FanGraphs.

Notable Challenges

There were a few notable challenges I encountered when working on this project. One was narrowing down the many features to the most important features that gave me the best predictions. As I discussed, there were many features to work with. But, simpler model models are generally preferred since they are easier to interpret and understand. This is where domain knowledge about baseball especially helped in identifying those important features. Additionally, reducing the margin of error for predictions was especially difficult. This was because there are those Superstar players who are making well above the average salary. There are other factors that are not necessarily explained in baseball statistics alone that can account for a player’s salary such as basic economic demand for a player in a particular off-season.

Want To Try Your Hand At Machine Learning?

Eric Au was a civil engineer that enrolled in Flatiron School’s Data Science course to change careers. He created this project as his capstone project, using all of the skills he’d learned during the program.

Think that sounds interesting? Try your hand at Data Science with our Free Prep Work and start learning how to make a machine learning project just like Eric’s today.

Zach Zazueta: From Financial Analyst to Data Analyst

Zach Zazueta, a 2020 Data Science graduate from Flatiron School, spent half a decade in the finance department of educational institutions before an interest in data-driven problem-solving led him down a different path. 

He details his path from finance to data science below.

A Foundation In Finance

When Zach Zazueta graduated from college in 2015, he knew that he wanted to combine his interest in math and economics with his degree in Political Science to work for a mission-driven organization. The mission he chose? Addressing unequal access to quality public education for inner-city minority students coming from low-income homes. 

“I was on a finance team in the education field working for a network of charter schools supporting 50 elementary, middle, and high schools in the NYC metro area,” Zach explained when we interviewed him in early 2023.

A few years in, he found himself working with data in Talent Analytics designing evaluation systems. It was during these exercises that Zach’s interest in data took hold and he began to consider a different career path.

“Eventually, the interest and enjoyment I was getting from the problem-solving outweighed the satisfaction I got from the organization’s mission,” he said. “It was time to enter a new environment with new business challenges that would push my learning.”

Pivoting To Data Science

Once Zach made the decision to switch from his current role, the decision to pursue Data Science seemed like an obvious one. 

“I always had a draw toward numbers-focused work. In my [early career] I found designing logic behind Excel formulas compelling. Mapping out data to tell a story and bring clarity was rewarding,” he recalled. “And after working with SQL and Tableau [designing evaluation systems], I knew they were areas I wanted to grow in.”

After dabbling in open-source materials and learning on his own for a time, Zach ultimately decided to apply to Flatiron School’s Data Science program to accelerate his learning.

“I was having difficulty making sustained, targeted progress in my learning. I saw Flatiron School as a unique opportunity to boost the nascent skills I had already developed and learn how to code quickly,” he explained. “And a bootcamp was a faster and less expensive avenue than a traditional master’s degree program.”

His Bootcamp Experience

Zach enrolled in Flatiron School’s online part-time Data Science program in 2019. Like many other students choosing to pursue a career change while maintaining their current employment, he initially found the added time requirements difficult to adjust to. 

“While I appreciated the flexibility that this option allowed me to have as I was able to continue working and earning income while enrolled, it was a big time commitment to tack onto regular life.”

But, throughout the course, he developed skills that proved invaluable once he entered the job market. 

“The module wrap-up projects were quite helpful as a practice to become an authority on a data project I owned,” he explained. “I’ve often had to present and explain findings to non-technical stakeholders [in my career], laying out the ‘so what?’ business impact of my analysis. It was also helpful to take a project from raw data to visualized findings – end-to-end projects can be the most rewarding.”

Working In Tech

Zach graduated from Flatiron School in 2020. Since then, he has been enjoying working in Data Science, mentioning that he uses the skills he learned during his bootcamp almost every day.

“[Working as a Data Scientist] absolutely lives up to the dream,” he said. “I am applying the skills I learned in Flatiron on a daily basis. 90%+ of what I do in my everyday job is coding, writing queries, and making data tell a story.”

The data that first piqued his interest and the data he uses now differ greatly in size and scope, a change that ties back to his early fascination with economics. 

“Shifting into tech has afforded me the opportunity to work with truly big data.  Working with data tables that are petabytes in size has been a vastly different experience than my time in non-profits,” he said. “I also now work for a global company instead of focusing on just one city; seeing how global markets impact the data has been a really exciting change.”

Reflecting On His Journey

Looking back at the beginning of his career change, Zach’s main takeaway was the necessity of a growth mindset. 

“The data community appreciates the learning journey. No one will expect you to know everything at once. They just want to see that you are equally passionate about solving the same types of problems they are,” he explained. “Because of that mindset, it is a terrifically collaborative space that allows learning to flourish.”

His advice for current students is to lean into the discomfort of that growth mindset and embrace the process. 

“Try and hold tight to the fact that this is a career change – and careers are measured in years, if not decades. If the first few years start slow, that’s okay; the growth becomes exponential once you have a foothold.”

Ready For A Change, Just Like Zach Zazueta?

Apply Now to join other career changers like Zach in a program that sets you apart from the competition. 

Not ready to apply? Try out our Free Data Science Prep Work and test-run the material we teach in the course. Or, review the Data Science Course Syllabus that will set you up for success and help launch your new career.

Read more stories about successful career changes on the Flatiron School blog.

Women In Tech: 4 Grad’s Stories | Women’s History Month

As of 2022, women make up only 28% of the tech industry workforce. For technical roles, that number is even lower. There are simply not enough women in tech. 

That’s why Flatiron School offers the Women Take Tech scholarship to begin closing the opportunity gap for women in tech. With this scholarship, we aim to do our part and start to help make tech equal for all.

In celebration of Women’s History Month, here are the stories of four recent female Flatiron School grads making waves in the tech industry.

Victoria LeBel: Registered Nurse to Software Engineer

Victoria LeBel began her career as a registered nurse. She spent 4 years working on a high-risk labor and delivery unit but felt that she needed to make a change.

“I was missing an element of creativity in my work,” she explained. “[But] I wanted to continue to use my critical thinking and problem-solving skills.”

Combining her acquired skills and her love of continuous learning, she determined that Software Engineering would be a great fit. To make the transition from healthcare to tech though, Victoria knew that she would need to pursue some additional schooling. It was then that she learned about Flatiron School.

Victoria enrolled in Flatiron School’s full-time Software Engineering program and graduated in September 2022. After a short job search, she accepted a Software Engineer position at Econify. 

“If you set your mind and efforts toward something you can accomplish anything. So long as you have the focus and determination, you can achieve anything, no matter where you started.”

Read her full career change story.

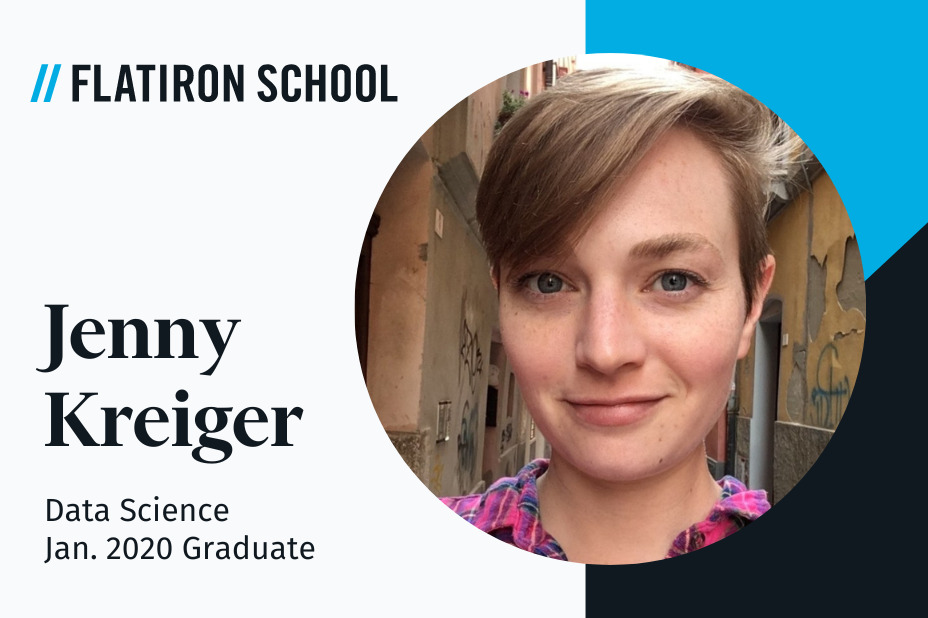
Jenny Kreiger: Archaeologist To Data Scientist

Jenny Kreiger began her career pursuing a Ph.D. in classical art and archaeology with the hopes of working in higher education or museums. But, as she helped excavate the ruins of Pompeii for the first summer in a row – a dream archaeological opportunity – she knew she was drifting away from studying human behavior. 

“The academic job market is notoriously challenging, so from the start of my doctorate, I was always researching and preparing for alternatives. Data Science was a possibility for me because as an archaeologist I liked using data to learn about human behavior.”

After trying out some online tutorials, she decided to quit her job and enroll in Flatiron School’s Data Science course.

She graduated in early 2020 and had the unfortunate circumstance of job searching during the beginning of the COVID-19 pandemic, but ultimately accepted a role as a Data Scientist at Shopify. 

“Lots of organizations need your expertise right now, and you might be able to find a great fit in an unexpected place, so don’t give up–adapt!”

Read her full career change story.

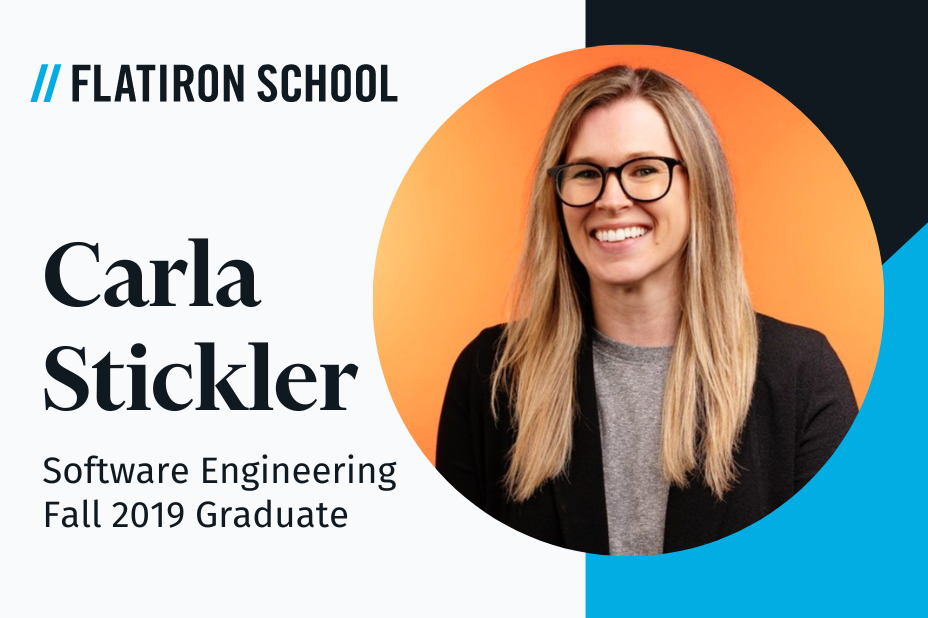
Carla Stickler: From Broadway Star To Software Engineer

Image of Carla Stickler

By the end of 2018, Carla Stickler already had what many would consider to be a dream career. She’d found success in the arts – a difficult feat no matter the medium – and performed on Broadway stages in world-famous musicals such as Wicked, Mamma Mia!, and The Sound of Music.

But, Carla recalls knowing that she needed to make a change for a while, saying that the continuous grind and needed to reach that level of success had begun wearing on her.

Finally, a chance encounter at her 35th birthday party spurred her to act.

“A friend showed up to my party and announced, ‘I’m a software engineer now and I just got a great job making more money than I’ve ever made with health insurance and a 401k!’ I was confused, since last I checked, he was a composer writing musicals,” she mused. “I held him captive for the next 30 minutes asking him how he did it and what exactly software engineering was. He told me he went to the Flatiron School and learned to code.”

Carla graduated from Flatiron School’s Software Engineering program in the Fall of 2019 and accepted a position as a Junior Software Engineer at G2.

“I cannot begin to tell you the number of things I’ve learned in the past year and the amount of confidence I’ve gained as a developer. I love my job and couldn’t be more grateful for the life that attending Flatiron and learning to code has provided for me.”

Read her full career change story.

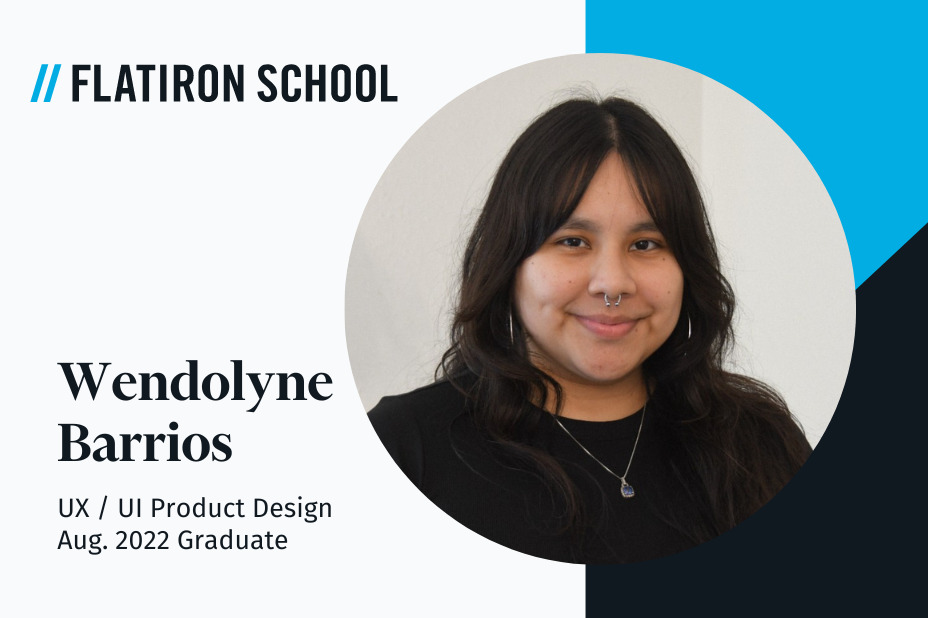
Wendolyne Barrios: Food Industry to Freelance Designer

Image of Wendolyne Barrios

Wendolyne Barrios spent the first 10 years of her career in the food service industry. She began helping in her family’s business, then pursued her own career in the field. But a decade in, Wendolyne knew she needed a change.

“Working in the food service industry is tough on the mind and body,” she said. “The field took more from me than I got back, so I knew I had to make a change if I wanted to live a healthy, enjoyable, and sustainable life.”

Fueled on by a lifelong love of the arts and her desire to live the life she’d imagined, Wendolyne applied and was accepted to Flatiron School’s accelerated 15-week UX / UI Product Design program.

Wendolyne graduated from Flatiron School in August of 2022 and began a career as a freelance product designer. In January 2023, she founded wendolyne.design, which specializes in brand design, web design, and mobile app design.

“I pushed myself harder than I thought I could. I pushed myself mentally and emotionally to come out of the other side of it and feel like I was finally going somewhere. It was worth it, for me to feel the way I do now.”

Read her full career change story.

Women Take Tech Scholarship

Studies show that companies with a diverse workforce are more innovative, creative, and productive, and earn more revenue. 

But, with 39% of women in tech saying that they see gender bias as an obstacle to getting a promotion, it is not enough to simply hire more women. There needs to be an industry-wide shift towards working environments that embrace and promote diversity. That starts with creating more opportunities for women. 

Flatiron School’s Women Take Tech scholarship does just that, granting up to $1,000 to eligible female students to get started toward a career in tech.

See if you qualify.