Data Science

Flatiron School
Meet the Mentor // Cass Rogers
Welcome to the eleventh episode in our “Meet the Mentor” series where we get to know Flatiron School mentors in an interview-style conversation. Whether you’re just starting out or looking to level up, these stories are packed with practical advice, encouragement, and insights to help you navigate your own path in tech. Each article includes […]
Data Science
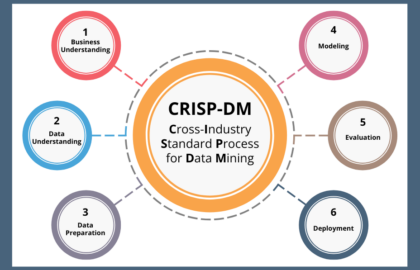
Intro to Data Science: Understanding CRISP-DM
Starting a journey in data science can feel like navigating a vast, uncharted territory. With so much data available across every industry, from healthcare to finance, how do professionals transform raw information into valuable insights? The answer lies in having a structured, reliable process. One of the most trusted frameworks in the industry is CRISP-DM. […]

Career Advice
What Do Data Analysts Do?
Gain insights into the key responsibilities of a data analyst role, plus the essential skills needed to succeed and the various career paths data analysts can travel down.

Data Science
Deep Learning vs. Machine Learning: What’s the Difference?
Neural networks, supervised learning, reinforcement learning — what are they, and how will they impact our lives?

Admissions
Insider Guide: Flatiron School’s Admissions Assessment
The admissions process for Flatiron School includes an assessment test. Here's insider tips on how to pass the admissions assessment.

Flatiron School
Meet the Mentor // Jasmine Daly
In her Meet the Mentor interview, she shares how curiosity and a deep passion for learning led her to explore many different applications of data science across industries. From biomedical engineering and aerospace manufacturing to becoming a data scientist, her story is a powerful example of how embracing change and following your curiosity can lead to a fulfilling and purpose-driven career in tech.

Software Engineering
7 Jobs You Can Get Knowing Python
For fledgling developers, Python is often one of the first programming languages they learn. Here are 7 jobs you could land by learning this versatile and easy-to-learn language.