
Predictive modeling is a process in data science that forecasts future outcomes based on historical data and statistical algorithms. It involves building mathematical models that learn patterns from past data to make predictions about unknown or future events. These models analyze various variables or features to identify relationships and correlations, which are then used to generate predictions. Well over half of the Flatiron School’s Data Science Bootcamp program involves learning about various predictive models.
Applications of Predictive Modeling
One common application of predictive modeling is in finance, where it helps forecast stock prices, predict market trends, and assess credit risk. In marketing, predictive modeling helps companies target potential customers more effectively by predicting consumer behavior and preferences. For example, companies can use customer data to predict which products a customer is likely to purchase next or which marketing campaigns will yield the highest return on investment.
Healthcare is another field that uses predictive modeling. Predictive modeling plays a vital role in identifying patients at risk of developing certain diseases. It also helps improve treatment outcomes and optimize resource allocation. By analyzing patient data, such as demographics, medical history, and lifestyle factors, healthcare providers can predict potential health issues and intervene early to prevent or manage them effectively.
Manufacturing and logistics widely use predictive modeling to optimize production processes, predict equipment failures, and minimize downtime. By analyzing data from sensors and machinery, manufacturers can anticipate maintenance needs and schedule repairs before breakdowns occur, reducing costs and improving efficiency.
Overall, predictive modeling has diverse applications across various industries, helping businesses and organizations make more informed decisions, anticipate future events, and gain a competitive advantage in the marketplace. Its ability to harness the power of data to forecast outcomes makes it a valuable tool for driving innovation and driving success in today’s data-driven world.
The Steps for Building a Predictive Model
Below is a step-by-step guide to building a simple predictive machine learning model using Python pseudocode. Python is a versatile, high-level programming language known for its simplicity and readability, making it an excellent choice for beginners and experts alike. Its extensive range of libraries and frameworks, particularly in fields such as data science, machine learning, artificial intelligence, and scientific computing, has solidified its place as a cornerstone in the data science community. While Flatiron School Data Science students learn other technical skills and languages, such as dashboards and SQL, the primary language that students learn and use is Python.
Step 1
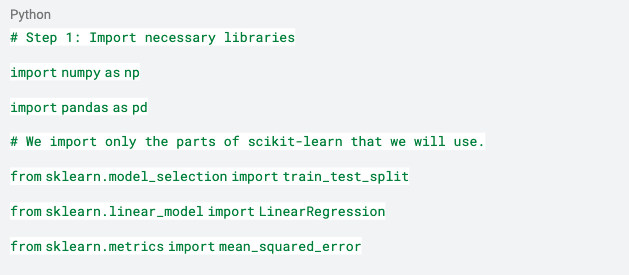
In Step 1 below (in the gray box), Python libraries are imported. A Python library is a collection of functions and methods that allows you to perform many actions without writing your code. It is a reusable chunk of code that you can use by importing it into your program, saving time and effort in coding from scratch. Libraries in Python cover a vast range of programming needs, including data manipulation, visualization, machine learning, network automation, web development, and much more.
The two most widely used Python libraries are NumPy and pandas. The former adds support for large, multi-dimensional arrays and matrices, along with a large collection of high-level functions to operate on these arrays. The latter is a high-level data manipulation tool built on top of the Python programming language. It is most well-suited for structured data operations and manipulations, akin to SQL but in Python.
The third imported Python library is scikit-learn, which is an open-source machine learning library that proves a wide range of supervised and unsupervised learning algorithms. It is built on NumPy, SciPy, and Matplotlib, offering tools for statistical modeling, including classification, regression, clustering, and dimensionality reduction. In data science, scikit-learn is extensively used for developing predictive models and conducting data analysis. Its simplicity, efficiency, and easy for integration with other Python libraries makes it an essential tool for machine learning practitioners and researchers.
Step 2
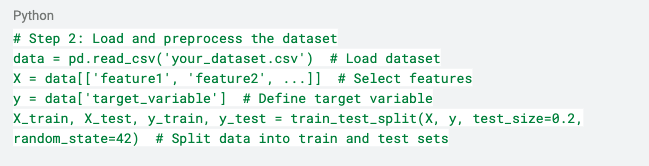
Now that the libraries have been imported in Step 1, the data needs to be brought in—as can be seen in Step 2. Since we’re considering predictive modeling, we’ll use the feature variables to predict the target variable.
In a dataset for a predictive model, feature variables (also known as predictors or independent variables) are the input variables that are used to predict the outcome. They represent the attributes or characteristics that help the model learn patterns to make predictions. For example: In a dataset for predicting house prices, feature variables might include:
- Square_Feet: The size of the house in square feet
- Number_of_Bedrooms: The number of bedrooms in the house
- Age_of_House: The age of the house in years
- Location_Rating: A rating representing the desirability of the house’s location
The target variable (also known as the dependent variable) is the output variable that the model is trying to predict. Continuing with our housing example, the target variable would be:
- House_Price: The price of the house
Thus, In this scenario, the model learns from the feature variables (Square_Feet, Number_of_Bedrooms, Age_of_House, Location_Rating) to accurately predict the target variable (House_Price).
Step 3
Note, We split the dataset into training and test sets in Step 2. We did this to evaluate the predictive model’s performance on unseen data, ensuring it can generalize well beyond the data it was trained on. This split helps identify and mitigate overfitting, where a model performs well on its training data but poorly on new, unseen data, by providing a realistic assessment of how the model is likely to perform in real-world scenarios.
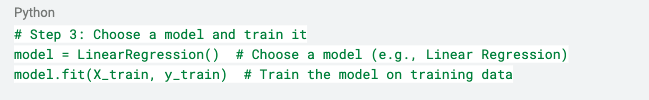
Now comes the key moment in Step 3, where we use our statistical learning model. In this case, we’re using multiple linear regression, which is an extension of simple linear regression. It is designed to predict an outcome based on multiple independent variables, and fits a linear equation to the observed data where the target variable is modeled as a linear combination of two or more feature variables, incorporating a separate coefficient (slope) for each independent variable plus an intercept. This approach allows for the examination of how various feature variables simultaneously affect the outcome. It provides a more comprehensive analysis of the factors influencing the dependent variable.
Step 4
In Step 4, we evaluate the model to find out how well it fits the data. There are a myriad of metrics that one can use to evaluate predictive learning models. In the pseudocode below, we use the MSE, or the mean squared error.
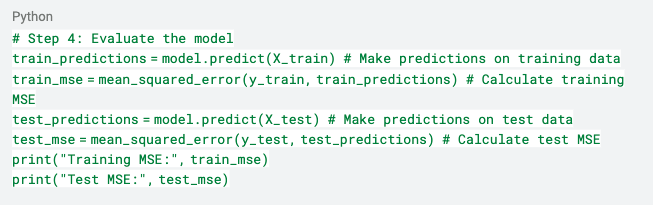
The MSE is a commonly used metric to evaluate the performance of a regression model. It measures the average squared difference between the actual values (observed values) and the predicted values generated by the model. Mathematically, it is calculated by taking the average of the squared differences between each predicted value and its corresponding actual value. The formula for MSE is:
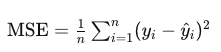
In this formula,
- n is the number of observations
- yi represents the actual value of the dependent variable for the ith observation
- ŷi represents the predicted value of the dependent variable for the ith observation
A lower MSE value indicates that the model’s predictions are closer to the actual values, suggesting a better fit of the model to the data. Conversely, a higher MSE value indicates that the model’s predictions are further away from the actual values, indicating poorer performance.
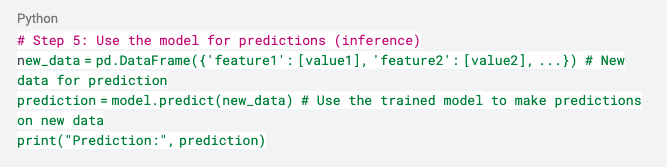
Step 5
At this point, one usually would want to tune (i.e., improve on the model). But for this introductory explanation, Step 5 will be to use our model to make predictions.
Summary of Predictive Modeling
The pseudocode in Steps 1 through 5 shows the basic steps involved in building a simple predictive machine learning model using Python. You can replace placeholders like `’your_dataset.csv’`, `’feature1’`, `’feature2’`, etc., with actual data and feature names in your dataset. Similarly, you can replace `’target_variable’` with the name of the target variable you are trying to predict. Additionally, you can experiment with different models, preprocessing techniques, and evaluation metrics to improve the model’s performance.
Predictive modeling in data science involves using statistical algorithms and machine learning techniques to build models that predict future outcomes or behaviors based on historical data. It encompasses various steps, including data preprocessing, feature selection, model training, evaluation, and deployment. Predictive modeling is widely applied across industries for tasks such as forecasting, classification, regression, anomaly detection, and recommendation systems. Its goal is to extract valuable insights from data to make informed decisions, optimize processes, and drive business outcomes.
Effective predictive modeling requires a combination of domain knowledge, data understanding, feature engineering, model selection, and continuous iteration to refine and improve model performance over time that lead to actionable insights.
Learn About Predictive Modeling (and More) in Flatiron’s Data Science Bootcamp
Forge a career path in data science in as little as 15 weeks by attending Flatiron’s Data Science Bootcamp. Full-time and part-time opportunities await, and potential career paths the field holds include ones in data analysis, AI engineering, and business intelligence analysis. Apply today or schedule a call with our Admissions team to learn more!