Why Do We Need Statistics for Data Science?

Data science needs statistics not only for descriptive and inferential statistics, but also for the statistical learning techniques of artificial intelligence.
I began the preceding post “Learning Mathematics and Statistics for Data Science” with the following definition: Data science is used to extract meaningful insights from large data sets. It is a multidisciplinary approach that combines elements of mathematics, statistics, artificial intelligence, and computer engineering. Previously, I described why we need mathematics for data science and in this article I’ll answer the companion question:
Why do we need statistics for data science?
However, before we can turn to that question, we need to talk about statistics in general.
What is Statistics?
Statistics is the study of variation of a population using a sample of the population.
For example, suppose we want to know the average height of American adult men. It is impractical to survey approximately all 80 million adult men in the United States; we’d just survey the heights of a (random) sample of them. This leads us to the two types of statistics that we need to know for data science: viz. descriptive statistics and inferential statistics.
The Two Types of Statistics for Data Science
Descriptive statistics is the branch of statistics that includes methods for organizing and summarizing data. Inferential statistics is the branch of statistics that involves generalizing from a sample to the population from which the sample was selected and assessing the reliability of such generalizations. Let’s look at some examples of each.
Descriptive Statistics
Data can be represented with either images or values. The following graph is a histogram of the distribution of heights of American adult men in inches.
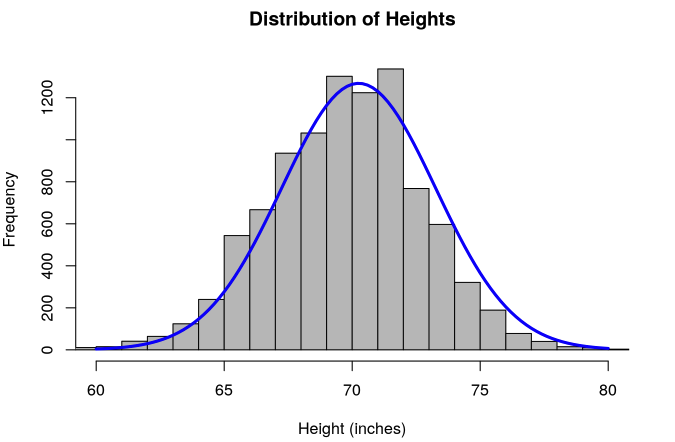
You are likely familiar with common descriptive statistics such as means, medians, and standard deviations. For example, the average height of American men is 69 inches. While there are more sophisticated descriptive statistics than these, they all serve the same purpose: to describe the data in some way.
Inferential Statistics
Inferential statistics uses descriptive statistics and probability to draw inferences regarding the data. The most common types of inferential statistics are confidence intervals and hypothesis testing.
Confidence intervals allow us to estimate an unknown population value (e.g., the height of American men in inches).
A hypothesis test is a method that helps decide whether the data lends sufficient evidence to support a particular hypothesis; for example,is the average height of American men greater than 69 inches?
Returning to our definition of statistics, we can see that the fundamental issue that statistics is dealing with, whether it is descriptive or inferential, is variation in the sample data. Also, using the sample data to draw conclusions about the population or populations of interest.
While statistics is used in many disciplines and applications, the way that data science uses statistics has some unique attributes. That said, what we have described forms the basis of the statistics that are used in data science. So let’s turn to that. I will note, of course, that we’re speaking in generalizations (the details are discussed in programs like the Flatiron School Data Science program).
There are three primary goals using data science with statistics.
- Regression
- Predicting an attribute associated with an object
- Classification
- Identifying which category an object belongs to
- Clustering
- Automatic grouping of similar objects
Statistical Learning in Data Science
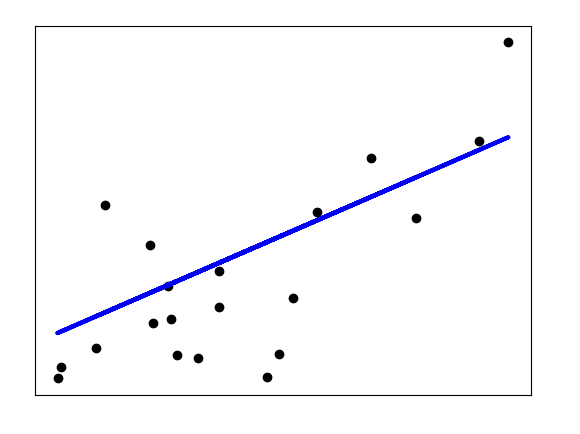
Regression, or prediction, models are the oldest of the machine learning models; in fact, they preexist computers. The basic version (simple linear regression) of these models is taught in introductory statistics classes. In the case of linear regression, the idea is to get a line that best fits two variable data.
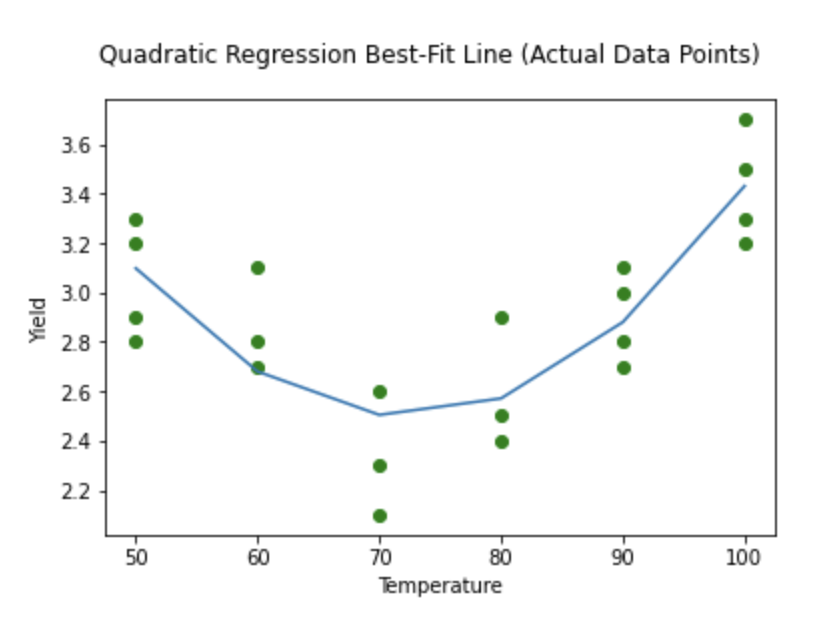
For other more sophisticated models, the idea is the same. For example, it could be the case that the data can be better modeled by a function other than a line such as a quadratic curve, as seen in the below image.
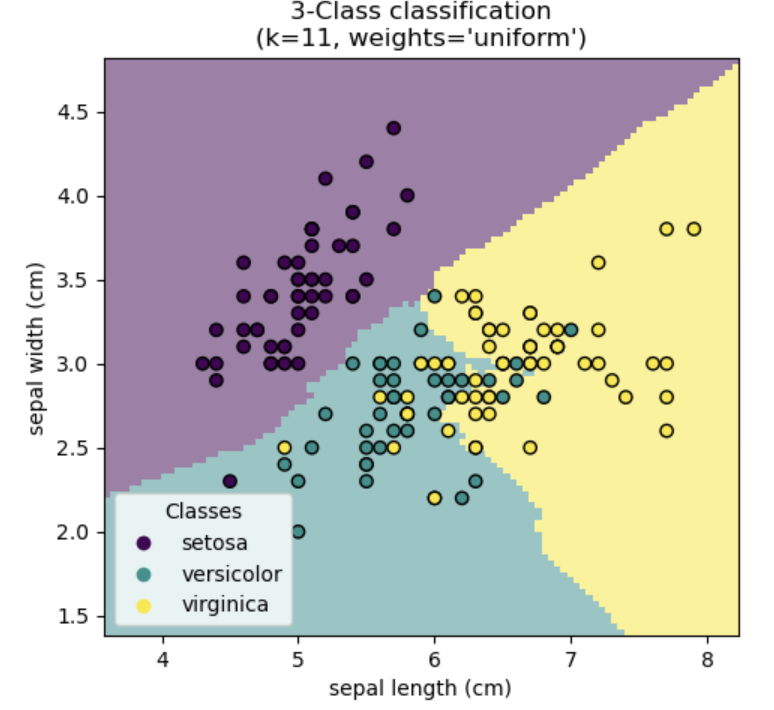
Classification models are used to determine which group a particular class a datum belongs to. The canonical example comes from the iris dataset where the data contains the sepal length (cm), sepal width (cm), and the three classes of irises: Setosa, Versicolor, and Virginica. The popular K-nearest neighbors model classifies each iris based on the sepal measurements, as can be seen in the below image.
Clustering models seem similar to classification models since the algorithms are also grouping data together; however, there is a fundamental difference. Classification models are an example of supervised learning. In other words, the machine learning algorithm is able to train on data (known as labels) with known outcomes so it can classify with new data. Clustering models are an example of unsupervised learning, where the algorithm is determining how to group the data. Clustering models like K-means separate the data into groups with similar statistical properties.
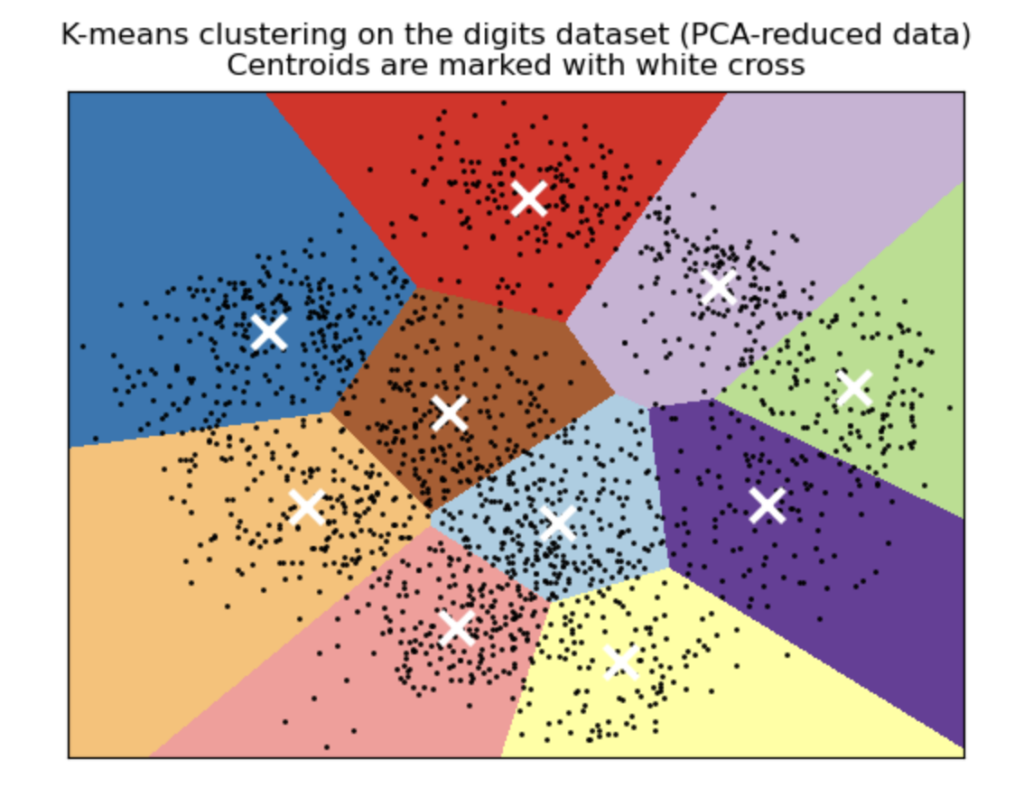
A common place where K-means is used is for customer or market segmentation of data, which is the process of clustering a customer base into distinct clusters of individuals that have similar characteristics.
The reason for statistics for data science is that we need statistics to understand the data through descriptive and inferential statistics. Further, in order to use the power of artificial intelligence, we need to be able to use statistical learning techniques.
Ready To Get Started In Data Science?
As a next step, we’d encourage you to Try out our Free Data Science Prep Work to see if data science is right for you.
If you realize you like it, apply today to start learning the skills you need to become a professional Data Scientist.
Not sure if you can do it? Read stories about students just like you who successfully changed careers on the Flatiron School blog.
Disclaimer: The information in this blog is current as of January 29, 2024. Current policies, offerings, procedures, and programs may differ.

About Brendan Patrick Purdy
Brendan is the senior curriculum developer for data science at the Flatiron School. He holds degrees in mathematics, data science, and philosophy, and enjoys modeling neural networks with the Python library TensorFlow.
More articles by Brendan Patrick Purdy