Learning Mathematics and Statistics for Data Science

Data Science is a rapidly growing field, but as prospective students consider data science, they often have trepidation about the mathematics and statistics involved. Learn why we need mathematics for data science.
Amazon Web Services helpfully informs us that data science extracts meaningful insights from large data sets and that it is a multidisciplinary approach that combines elements of mathematics, statistics, artificial intelligence, and computer engineering. The Bureau of Labor Statistics reports that data scientist is tracking to be the fastest growing data-related occupation through 2031.
For someone who has a desire to learn data science it can understandably be quite daunting to learn the broad and technical skills needed to become a successful data scientist. In particular, those of us considering becoming a data scientist often have reservations about the mathematics and statistical knowledge needed. While studying data science one uses calculus; probability and probability distributions; descriptive and inferential statistics to include linear and logistic regressions; and linear algebra (among additional mathematical and statistical concepts).

This blog post is the first in a series that looks at the mathematics and statistics needed to succeed in data science. This inaugural post considers this fundamental query: why do we need mathematics for data science? The sequel will appraise the direct follow-up question: why do we need statistics for data science?
The remainder of this blog series will examine particular examples of mathematical or statistical concepts in use in data science.
Mathematical Models and Treating Data Science as a Science
So why do we need mathematics for data science? An obvious answer is that data is often numbers (called numeric or quantitative data), e.g., the number of siblings one has or the height (in inches) of NBA players. While this is certainly true, and speaks to the first word of the phrase “data science,” the overarching reason the student of data science must be conversant in a myriad of fields of mathematics is because data science is a science. One of the hallmarks of a science is that it can be explained using mathematical models with the germane notation.

Second Law Of Motion
One of the most famous examples of a mathematical model comes from 1687 and it is still fundamental to the study of classical mechanics. Newton’s Second Law of Motion states that a force is equal to mass times acceleration, or in terms of a mathematical model using the appropriate notation:

(The “bar” here represents what we call a vector.)
The purpose with this example is not to dwell on what vectors are in particular or what physics is in general, but to highlight the importance of mathematics to science. Newton’s idea of the relationship between force and the product of mass and acceleration becomes understandable and usable by others when put into mathematical notation.
The goal of the data scientist is the same as that of the physicist, but instead of trying to understand how the universe works, the data scientist wants to understand how the data works. Among other goals, the data scientist wants to:
- Classify which category an object belongs to
- Predict an attribute associated with an object
- Automatic clustering of similar objects into groups
All of these can only be done with mathematical models as the foundation of the algorithms that are implemented in the programming language of the data scientist’s choice (typically Python or R).
A Toy Example
Let’s consider a toy example to close this blog post, but one that we’ll return to with a follow-up post. While any memory of what was covered in beginning algebra may be quite hazy for us, it is typically recalled that y = mx + b represents the equation of the line, where m and b are, respectively, the slope (“rise over run”) and y-coordinate of the y-intercept (“where the line crosses the vertical axis”) of a line.
Suppose we have a slope that runs 5 units in the positive x direction for every 9 units it rises in the positive y direction, i.e.,
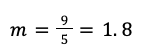
Further, let’s assume that the y-intercept is 0,32.
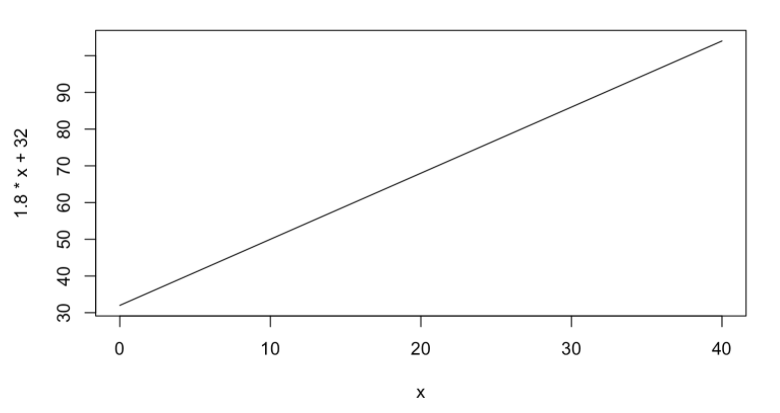
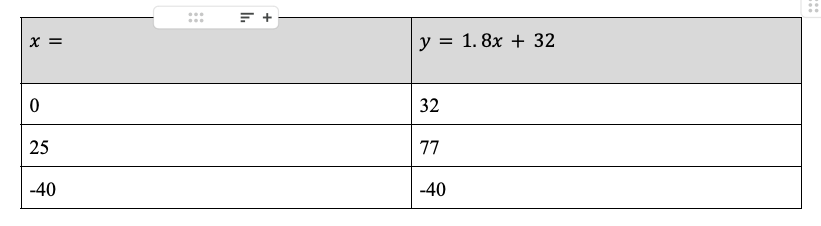
Thus, the equation of this line is y = 1.8x + 32, which you can see above. This likely seems a relatively innocuous line and perhaps even arbitrarily constructed. But let’s think about it for a moment by replacing x with some values as can be seen in this table. We can see if we let x equal to 0, then y is equal to 32 and so on.
Temperature Conversion Equation
Perhaps we don’t quite see the relevance yet, so let’s rename the two variables and rewrite the slope as a fraction:
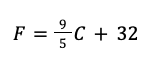
Yes, we see it now. This line models the relationship between Fahrenheit and Celsius.
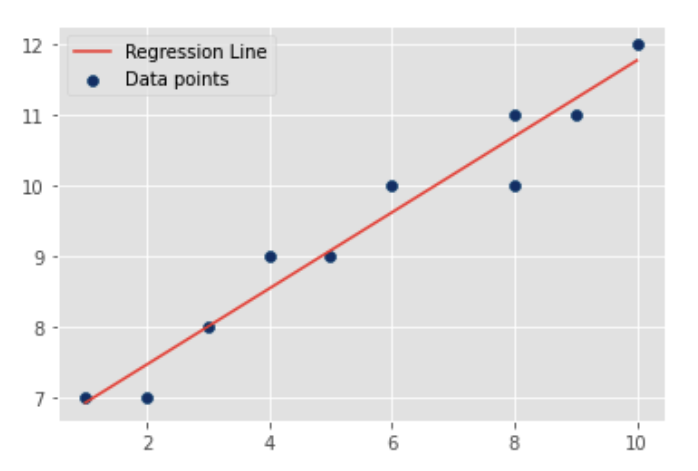
While we can use the equation of a line to model a formulaic relationship between two different units of temperature, what is the moral of the story for this first post? The essential idea is that we are able to use a line to model a relationship between two variables of interest. In this case, the variables were Fahrenheit and Celsius, but we can also use a so-called regression line to model two variables that have come from data that are not perfectly linear (see below; we’ll return to this idea in a future post). Ergo, mathematics allows us to model data, which is why we need mathematics in data science.
Disclaimer: The information in this blog is current as of January 25, 2024. Current policies, offerings, procedures, and programs may differ.

About Brendan Patrick Purdy
Brendan is the senior curriculum developer for data science at the Flatiron School. He holds degrees in mathematics, data science, and philosophy, and enjoys modeling neural networks with the Python library TensorFlow.
More articles by Brendan Patrick Purdy