Everywhere you look, the world is awash in data — big data, personal data, data about data, you name it. Every business is neck-deep in data. Organizations need to use this data — in a process called data analytics — to discover business trends, identify issues, and formulate insights from the data floating in their systems.
Data analytics is the practice of analyzing and managing data for decision-making. Data analytics is a field in data science that continues to grow and evolve. Companies need people who understand how to use data analytics and communicate the results clearly to all stakeholders.
For example, if you’ve ever seen a marketing report projecting future sales of a product or the success of an ad campaign, you have seen the work of a data analyst. A data analyst generates regular and ad hoc analyses to help the organization beat competitors and improve performance.

What is the role of data analytics?
Data analysts work at the intersection of information technology, statistics, and business.
A data analyst's goal is to increase the efficiency and productivity of a company by identifying patterns in the available data.
Data analysts find meaningful stories in the data to give meaning to large data sets.
A data analyst’s primary role is to scan and analyze data. Once they analyze the data, data analysts give reports, visualizations, and explanations to help the organization better understand their data and glean actionable information from it.
Data analytics has several steps, including:
-
Data mining (the most time-intensive step)
-
Data warehousing, often called data management
-
Extracting and processing data using SQL and business intelligence software
-
Maintaining metrics dashboards using Excel and platforms like Tableau
By applying statistical analysis and other processes to large batches of digitized information, the data analyst extracts insights and communicates them clearly to the organization's stakeholders.
While the presentation is the final step, clarifying insights for a non-technical audience is crucial for a data analyst's role
Why is data analytics important?
Data analytics is crucial for improving efficiency and performance in a wide variety of industries. For example, in a world where ransomware has become a mainstream term, data analytics helps detect and prevent fraud. The practice has been applied to most areas of healthcare and provides valuable observations about customers.
It’s not enough to gather data from business processes. Data analytics leverages and explains that data to increase competitiveness, helping businesses grow and thrive.
If you become a data analyst, your job will help steer your organization in the right direction.
What does a data analyst do?

Data analysts have a range of responsibilities depending on the industry and company.
Data analysts translate numbers into plain language. Their primary role is to scan and analyze data. Then, they find ways to visualize data and explain their conclusions to an audience that contains people from multiple backgrounds. They develop reports, explanations, and visualizations using a number of tools.
Business software and SQL proficiency are critical for interpreting data and analyzing trends and patterns for diagnostic and predictive analysis. While you don’t need expert programming skills, learning Python and R can help you stand out from the pack.
A data analyst’s job is to help business leaders understand what the data is indicating. Armed with the wisdom extracted from their massive data stores, stakeholders go forth to take their organizations to the next level.
Data analysts leverage several analytical methods to identify past issues and future outcomes. If you love numbers, programming, and statistics, you will love being a data analyst.
What are the different types of data analytics?
Data analytics comes in several flavors. Each answers a different type of question. Do you want to learn what happened the past two quarters and why? Or do you want to use that data to determine what went wrong (or right) and make better decisions for the future?
Descriptive analytics
Descriptive analytics answers the question of what happened in the past. The data analyst mines the data looking for patterns and trends. There is no explanation of the historical data, and it does not establish any cause-and-effect analysis. It’s a surface-level examination of what already happened.
Diagnostic analytics
Diagnostic analytics answers the question of why something happened in the past. Data analysts use it to identify anomalies and look for causal relationships. Diagnostic analytics uses tools such as regression analysis, filtering, and time-series data analytics to discover the reasons for what happened before.
Predictive analytics
Predictive analytics answers questions about what will happen in the future. It analyzes historical data and uses probability theory to determine likely future outcomes. Data analysts use predictive analytics to forecast outcomes, such as determining which products will be most popular during a particular season or how much company revenue will increase or decrease over various periods.
Prescriptive analytics
After determining the what and why of the past and predicting future outcomes, prescriptive analytics helps answer the question of what an organization should do. It comes up with actionable data that has the most significant impact on a company's decision-making process as well as its bottom line.
Prescriptive analytics works with algorithms, machine learning, and computational modeling. It is much more complex than the other three analytical types.
So far, we’ve defined data analytics and why the field is so important. Also, we've looked at the different types of analysis available to answer different kinds of questions. Now, let’s take a look at the process of data analytics.
What is the data analytics process?
The data analytics process gives you a blueprint to follow for how to complete your work. This is a “standardized” process that new data analysts often use when they are first learning the craft. As you learn and become more comfortable with data analytics, you may refine and hone your own process. But, this process is a good one to follow so you can complete a quality project for your stakeholders.
Step 1: Define the question(s) you need to answer
During the first step, a data analyst identifies why the organization needs to conduct an analysis of a topic and frames the question to answer or challenge to solve. Data analytics involves more than analyzing data. It includes making sure the business asks the right questions and identifies the correct challenge.
Step 2: Collect the data
This step is the most time-intensive in data analytics. It is the step where most of the upfront work is performed, including
-
Data collection
-
Integration of the data
-
Data preparation
-
Development, testing, and revision of analytical models to provide an accurate result
You need a straightforward question before performing data collection because you don’t want to inundate yourself with irrelevant information. Vague questions create an environment for data overload and opaque results.
Collect data from primary or internal resources such as your customer relationship management (CRM) solution or your email marketing tools. You may be required to combine data from different source systems that do not share the same data integration routines.
Once you collect the data, you transform it into a standard format and load it into an analytics system, such as a Hadoop cluster, a NoSQL database, or a data warehouse.
Step 3: Clean the data
Once you gather data from your primary sources, you’ll likely find data duplication, missing data or gaps in the record, or corrupted data. Before analysis, you need to clean up and clear out the duplicates and resolve problematic data. You’ll perform data deduplication, consolidation, and reconciliation.
Now you have clean, complete data from which to source your analysis.
Step 4: Analyze the data
The type of analysis you perform depends on the question you are asking. Do you want to know what happened in the past or why something happened? Or do you want to know what the future brings or the actions your organization should undertake?
Standard techniques for analyzing data include regression analysis, cluster analysis, and time-series analysis.
Step 5: Interpret and share the analysis
In this step, it’s essential to select the best way to present your findings so that everyone understands and is on the same page. Data analysts employ charts, graphs, and other visualization methods for making sense of the data for a non-technical audience.
Put it all together
Data visualization enhances columns of raw numbers, helping everyone make sense of the information presented and develop actionable answers.
As a data analyst, you demonstrate what the analysis tells you about your question or business challenge. Then you collaborate with key stakeholders to move forward. Data analytics also highlights the limitations of the analysis and helps you determine the type of further analysis to undertake.
The analytic process shows the difference between a data analyst and a data scientist. A data scientist produces broad insights, focuses on business needs, provides strategic oversight, and concentrates on deep learning. A data analyst answers specific questions and creates models to help answer them.
Essential data analysis methods help data analysts arrive at those answers.
What are data analysis methods?
Data analysts employ a variety of analytical methods.
-
Cluster analysis — sometimes called segmentation or taxonomy analysis, it is used to identify structures within data
-
Cohort analysis — a behavioral analysis that allows data in a set to be divided into related groups for analysis
-
Regression analysis — used for estimating how independent variables affect dependent variables and for finding the correlation between two variables
-
Neural networks — a series of algorithms that helps recognize the underlying relationship in a set of data using a process that mimics the human brain
-
Factor analysis — describes observed variables in terms of a smaller set of unobservable or latent variables, also known as factors
-
Data mining — uses algorithms to extract meaningful data during the process of discovering knowledge in databases (KDD or knowledge discovery in databases)
-
Text analysis — also called text mining, text analysis examines textual data to find information or answer specific questions
A data analyst can expect to use one or more of these methods in their daily work.
We’ve talked a lot about data analytics, but is there any difference between data anlaysis and data science?
What is the difference between data analytics & data science?
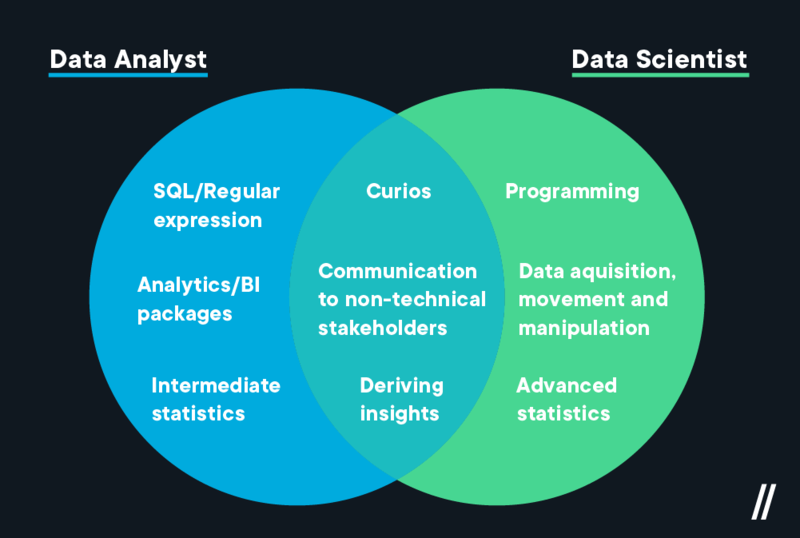
Both data analytics and data science make valuable contributions to business operations and success. However, there are some differences in skill set requirements.
Data scientists understand and can perform software development, data mining, and data analysis.
-
Like data analysts, data scientists study data to uncover valuable information to make predictions and decisions.
-
However, they are also proficient in data science programming languages Java and Python, and other technical skills like machine learning and object-oriented programming.
-
They specialize in data acquisition, movement, and manipulation, as well as advanced statistics and math.
Data scientists collect, clean, and explain data using their programming skills to tweak and adjust statistical and mathematical models applied to the acquired data. Learn more about becoming a data scientist.
Data analysts are proficient in intermediate statistics and the language of databases for querying, such as SQL.
-
They also have some skills in a programming language or two but primarily use them for cleaning and normalizing data.
-
Querying and communication skills are the top requirements for data analysts.
-
They are also skilled Excel users.
-
A data analyst searches for answers, insights, and patterns in the data, often using business intelligence software.
In short, a data analyst is a gatekeeper over an organization's data, helping stakeholders to understand data to make strategic business choices.
If data analytics sounds interesting to you, you should expect to master a few skills.
Further reading: Data Analyst vs. Data Scientist — What's the Difference?
What skills do you need to become a data analyst?
To be a data analyst is to be a mathematician, but you don’t need a math degree or advanced computer programming skills. You spend most of your time working with numbers, but you don’t just crunch data and share a graph or two. You must understand what the numbers are telling you and dig deeper if needed.
A strong sense of intellectual curiosity is essential. Data analysts are detail-oriented people who have strong backgrounds in math, science, and predictive analytics. They collect, organize, analyze, and disseminate substantial amounts of information with high-level accuracy.
Communication skills are vital for a data analyst. You will be presenting your findings and explaining what they mean to other stakeholders. They may not be technically proficient, so you will need to be able to get your point across in a language they understand.
Data analysts use SQL, Python, R, and other query and programming languages. Python is a free, open-source programming tool used to analyze large data sets, connect APIs, or scrape the web. R is another free programming tool for mining and analyzing data that works similarly to Python.
Data analysts also use a suite of tools to manipulate and understand large batches of data, including:
-
Tableau — a visual analytics platform
-
SQL consoles — SQL files for composing and executing SQL statements
-
ETL tools — tools for extracting, transforming, and loading data for integration
-
Statistical analysis tools — software for statistical analysis
-
Predictive analytics tools — tools for data mining, machine learning analysis, and other activities
Data analysts are often tasked with building statistical dashboards using tools such as PowerBI, Adobe Analytics, or Looker. Excel and Tableau are other common database visualization tools. Additional responsibilities in data analytics include:
-
Interpreting trends from historical data
-
Preparing summary reports
-
Developing data pipelines
-
Information management
A data analyst collaborates with other stakeholders to formulate the right questions, communicate the answers, and provide actionable intelligence. As such, data analysts are much in demand. With supply short and demand high, data analysts are well compensated for their work.
How much do data analysts make?
According to Salary.com, the average base pay and pay range, updated as of May 2021, are as follows.
Nationwide
-
Average base pay: $78k
-
Range: $68k to $87k
New York
-
Average base pay: $73k
-
Range: $82k to$105k
San Francisco
-
Average base pay: $97k
-
Range: $86k to $109k
Austin
-
Average base pay: $77k
-
Range: $67k to $86k
Houston
-
Average base pay: $80k
-
Range: $70,179 to $89,169
Seattle
-
Average base pay: $85k
-
Range: $75k to $95k
Los Angeles
-
Average base pay: $88k
-
Range: $77k to $98k
Chicago
-
Average base pay: $83k
-
Range: $73k to $92k
Denver
-
Average base pay: $79k
-
Range: $69k to $88k
The future of data analytics
Villanova University found that 82% of businesses plan to expand data analytical functions. Industries looking for data analysts include healthcare and pharmaceuticals, marketing, and financial services, among many others. The Bureau of Labor Statistics projects 25% job growth for the field through 2029, much higher than the average for all occupations.
Data analytics is a fast-paced field that is constantly changing. There is lots of potential for the future since the world is producing more and more data. Many software tools are becoming open-source, providing a more comprehensive array of tools to master than ever before.
Data analytics uses machine learning, deep learning, natural language processing, and AI enabling machines to learn from existing data and predict more accurate outcomes. Technology companies are already working on quantum computers to revolutionize the industry and exponentially speed up processing to keep up with the ever-increasing flood of big data.
An abundance of tech jobs, including data analytics, is growing in places outside of the traditional tech strongholds such as Silicon Valley. Texas has several cities competing for talent in technology. Other cities such as Charlotte and Raleigh, NC, and Orlando, FL, are seeing a steady rise in tech job openings.
The 2021 Dice Tech Salary Report shows tech salaries in Baltimore are up over 5% from 2020 and Philadelphia saw an 8% increase in tech salaries. Minneapolis and Detroit both saw increases of 6% or more.
There has never been a better time to prepare for a career in data analytics. Bootcamps are an excellent way to obtain new skills quickly without attending a university or trying to learn everything on your own.
Flatiron School offers data analytics bootcamps to help you learn everything you need to know to start a data analysis career. Learn more about our courses, including taking a free introductory data science workshop for free.
Frequently asked questions about data analytics
What does data analytics mean?
Data analytics is a career field where an individual — often called a data analyst — gathers, sorts, analyzes, and reviews data in order to determine trends or predict future outcomes so that a company can make business decisions based on this past data.
Which companies use data analytics?
Lots of companies use data analytics, especially tech companies. In fact, many data science bootcamp grads have been hired at companies such as Salesforce, Slack, AT&T, and NASA. Any company that wants to analyze data and use data to predict future business trends should be using data analytics.
Why is data analytics important for business?
Ultimately, data analytics is important for businesses to understand how to improve their organization so they can beat out the competition. Data analysts can help their organizations understand what happened in the past, and find trends so they can make improvements to their processes and products.
What are the top 3 skills for data analysts?
Data analysts need to be proficient in the following areas:
-
Mathematics, particularly statistical modeling
-
Database querying and languages such as SQL
-
Communications, especially translating numbers into stories
Business intiution is helpful, too. If you love numbers, programming, and statistics, data analytics may be the role for you.
Is data analytics a good career?
Data analytics is a well-defined career that shows growth potential for the next decade and beyond. If you like math and collaborating with others, data analyst can be a satisfying position. Focusing on a specialty, building a portfolio, and getting a few data analysis certifications can help launch your career or increase your salary potential.
Is data analysis hard?
Data analysis is a fairly technical career since it requires an understanding of statistics, databases, and data communications. It is a challenging yet rewarding career for those who enjoy crunching and interpreting numbers and translating them for a non-technical audience. Think of it as being a storyteller finding truths and insights in data.