The Art of Debugging

Debugging code is often more of an art than anything. Technical Coach Joe Miius explains how to debug and get your code working correctly.
This article on the art of debugging is part of the Content Collective series, featuring tips and expertise from Flatiron School staff members on topics ranging from program success to the job search. This series is a glimpse of the expertise you can access during your program at Flatiron School.
Despite what one might assume, the essence of coding is not writing code that creates something you already know how to create. It is finding the solution to problems that are occurring in code that you have never written before. Though the endpoint of a project is the finished product everyone sees, the real work is done through the debugging process to get the product working before and even after launch. This is the beauty of programming. And, the better you get at it, the better programmer you will be.
Finding Your Debugging Tool
Each language comes equipped with tools that programmers can use to determine how their code works. These tools help find any problems that might be occurring in the code.
In different programming languages, there will probably be two kinds of tools for debugging. This first kind will be to see the values of variables and functions in the terminal or console as all the code is run (i.e. Javascript and console.log, Ruby and puts, Python and print). The second kind will be a stoppage in code so that you can evaluate each value at that place in the execution of code (i.e. Javascript and debugger, Ruby and IRB, Python and ipdb). Each of these is very useful for finding where the values of the code are changing and possibly being used the wrong way.
Personally, I prefer the console.log type of debugger because I like to look at the full runtime of the code, which allows me to trace an error through the code more effectively. For instance, if a parameter I am using in a function is showing up as undefined then at each point the function is being called I can console.log the value being passed in and trace the one that is undefined to where it is originating. Each programmer will have a preference of what they like to use though, so you need to find which makes the code clearest to you.
Where to Start Using Your Debugging Tool
The valuable thing about these tools is that they allow you to follow the data through the control flow of the code. This is imperative to find what is wrong with the code if it is not performing the intention it is written for. To fix this, you must start at the point of the error. The point of the error is when your code had been working then something new was introduced, and suddenly the code is no longer working.
An example of a starting point might be seeing an error in the console of the browser that looks like this:
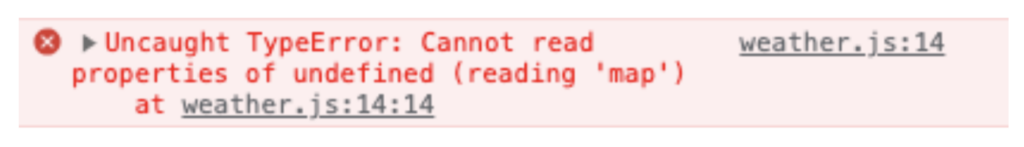
This shows you that something you are trying to use the .map method on is showing up as undefined. You can find this code at the file and line that is in the weather.js file on line 14 in the upper right corner. After you have found where the error is occurring you can then check what each value is and trace each step of the value and how it got to the place in the code it was failing. The question of what is happening at that point of error and what should be happening will give you the greatest insight into how to fix the problem.
How to Research Your Issue
To develop the question of how to fix the flow of the code, it is essential to narrow the question to the essential aspect of what you want the code to do and how you want it to manipulate the data in the variable or function. Once you know the exact point of where the information is changing in the wrong way, then you can isolate the question you need to research.
In the example above, once you have traced the code back to where the variable is being set to an undefined value, then you can ask the question why is the variable being set to undefined at this point. This will allow you to look for a specific way to solve the problem. Whether you are asking Google, using ChatGPT, or perusing the documentation, with the right question in mind the answer will become easier to find. The more specific the question you ask, the more specific the answer you will get back. It will also provide you with the knowledge to parse through information that does not apply to your situation. Many people are willing to offer their expertise but it is your job to find the solution that best matches your question.
Conclusion
By finding your system of debugging and developing fluency in tracing code to the source of an error, you can then describe the process to potential employers and show that when you say you can solve problems it is not just lip service. A systematic way of debugging shows employers that you have used the process before and solved complex problems through that process. It will give them more trust in your ability to tackle bugs that might occur in the new feature you might be working on for them. Get good at debugging and employers will notice.
About Joe Milius
Joe Miius is a Software Engineering Technical Coach at Flatiron School. He has previous teaching experience and has been helping Flatiron School students understand coding concepts for 2 years. He loves problem-solving and takes on each new problem or question a student presents with vigor and curiosity.
Disclaimer: The information in this blog is current as of September 20, 2023. Current policies, offerings, procedures, and programs may differ.