Diagnostic Dojo: How to Resolve OS X Performance Issues [Tutorial]

This blog is part of a continuous series that highlights experiences, insights, and tutorials from learning developers at Flatiron School in Web and iOS.STOP! Helpful time-savers below: Who is this post for? Absolute beginner programmers (please resume coding if the Abstract makes your eyes roll…) Abstract: Using Activity Monitor GUI on Mac OS X Yosemite, combined […]
This blog is part of a continuous series that highlights experiences, insights, and tutorials from learning developers at Flatiron School in Web and iOS.STOP! Helpful time-savers below:
Who is this post for? Absolute beginner programmers (please resume coding if the Abstract makes your eyes roll…)
Abstract: Using Activity Monitor GUI on Mac OS X Yosemite, combined with Terminal commands (specifically ps aux, top & grep) can help diagnose, isolate and resolve OS X system performance issues.
If you’ve been simultaneously programming, browsing, listening to music, testing new ideas in Terminal, Tweeting, blogging and whatever else it is you do with you’re computer, you have not only stepped into the realm of questionable productivity, but you have entered the incredible world of computer multitasking.
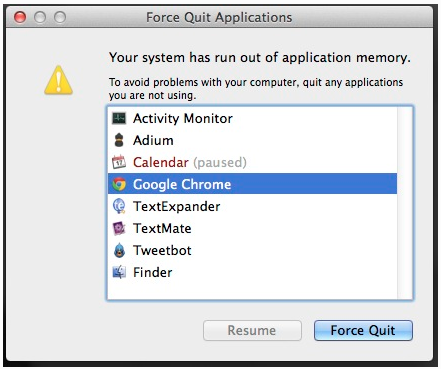
We will explore computer memory deeply in future blog posts. However, in this post, let’s look at the following warning:
In this moment you may be thinking…

If this reference is foreign, please view Office Space at your earliest convenience.
You may also be thinking, “Wait… I have a tool for this. I know I have a lot of memory on my Macbook. It has to! Steve Jobs wouldn’t leave me hangin’ like this!” Let’s take a look:
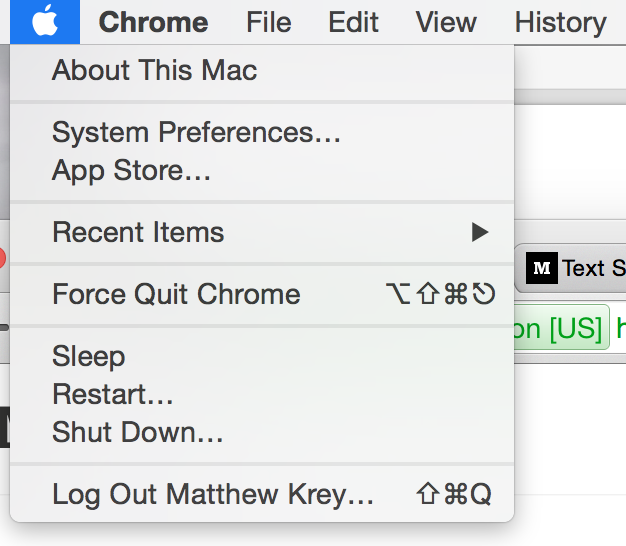
Select About This Mac
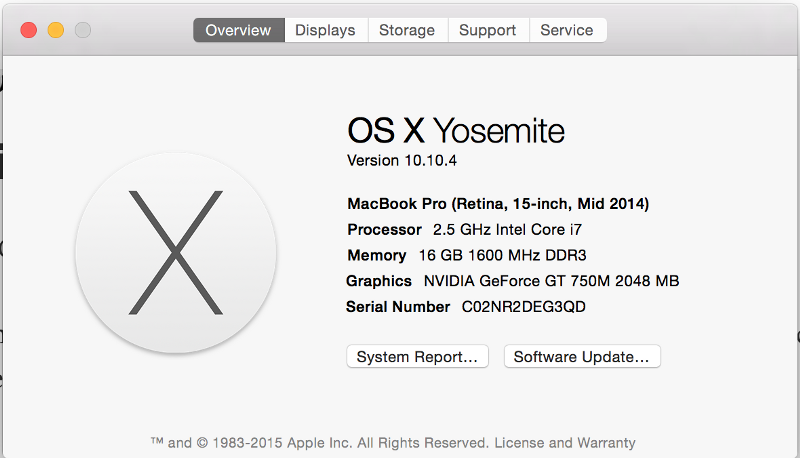
Memory indicates how much random-access memory (RAM). RAM allows data items to read and written in approximately the same amount of time, regardless of the order in which data items are accessed. If that sounds confusing, no worries — RAM is similar to short-term memory in our human brains.
Hmm… depending upon how many processes we have running on our machine, we may not even be able to view this window. We need a tool that will allow us to see (1) all of the processes that are running on our machine and (2) tell our computer to isolate and stop the processes that are putting the over-bearing strain on our CPU and Memory in language that our computer can understand (Yelling at your machine does not work… trust me.)
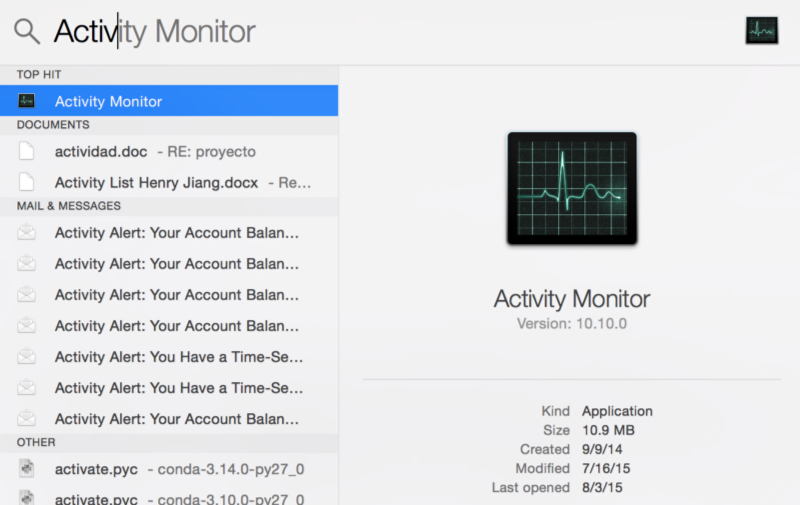
Let’s meet Activity Monitor. Open Spotlight (Command + Space), search for and open Activity Monitor:
Activity Monitor
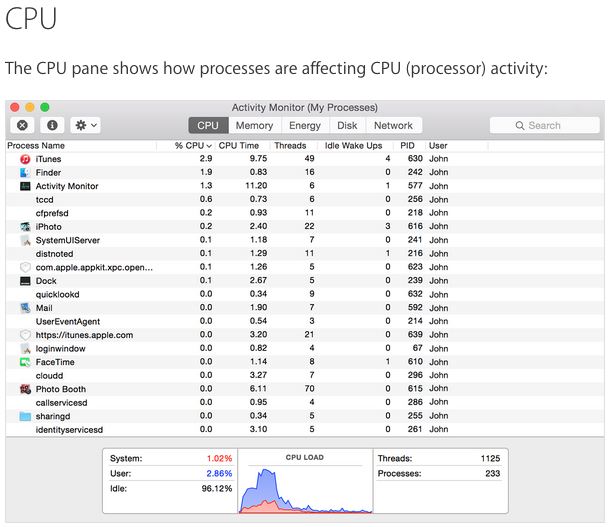
Now we have a Graphical User Interface (GUI) Application for viewing all of the processes running on our machine. We can view three critical pieces of information CPU Load(User), CPU Load(System), and the Process Identifier (PID).
The graph moves from right to left and updates at the intervals set in View > Update Frequency. The color blue shows the percentage of total CPU capability currently used by user processes. The color red shows the percentage of total CPU capability currently used by system processes.
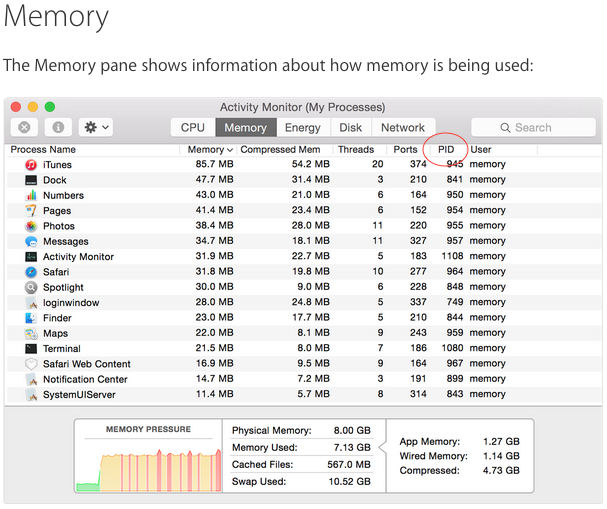
We can think about Memory Pressure like the “Warning” light we see on every action movie dashboard. Green, “We’re okay.” Yellow, “Warning. Warning.” Red, “Get to da choppah!”
If we dive one layer deeper, we can see an illustration of the availability of the memory resources on our machine. Let’s suppose that a particular process, denoted by a PID, is consuming a very large percentage of our CPU and Memory — how do we stop it?
Thankfully, we have an application that allows us to access and speak to the core of our machine — Terminal. Open a new Terminal and enter the top command:
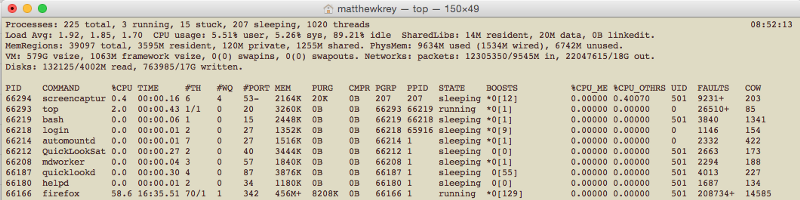
Notice any similarities? The output we see from the top command in Terminal is actually what we see in Activity Monitor. The difference is that we are looking at BASH text output instead of easy-to-interpret windows and graphs via our Activity Monitor Application.
Top returns all of the processes running on our machine (again, notice the PID in the first column). How do we now tell our machine to isolate a particular process and stop it using language that our computer understands? Thankfully, there are BASH commands that allow us to speak to the “core” of our machine directly and return the information we need.
Let’s think about what we want to do. We need to search through all of the processes running on our machine, find exactly the PID or process name that we are looking for, and display the user/owner of the process.
In above image, notice that “firefox” is consuming 58.6% of our CPU. Let’s suppose that this is the process that is causing our application memory to be experiencing super high pressure — we want to stop it. We can search for this process, either by process name or by PID, and return exactly the information we are looking for.
Let’s search by process name first:

Hmm… that doesn’t look entirely like what we search for. But let’s think about what commands we entered. “ps” returns processes that are being run, the “-a” flag returns processes for all users, the “-u” flag returns the processes’s user/owner, “-x” shows the processes not attached to a terminal. We use a Regular Expression, “grep” (get/REGULAR EXPRESSION/print), to search for a pattern of characters matching “firefox” and we pipe those return values to “ps aux”. Remember, our computers are super literal and will return exactly the characters we are searching for.
If you are more comfortable thinking in references by number, we can search by PID:

Nice! We have isolated the process that is consuming such a large amount RAM. Let’s shut it down and give our machine some room to run. We can do this via the BASH “kill” command in Terminal:

If a blank prompt is returned with the root user and your current directory, the process has been killed. We can verify it has been killed by trying to kill it again (just to make sure):

Congratulations! You have relieved the pressure on your machine’s memory and/or CPU and can resume normal functioning.
Remember, your Terminal (BASH) gives you complete control over your machine. It may take some time to adjust your brain into understanding what your computer is doing via text input/output (I/O), but you will always be able to communicate with your machine via the Terminal.
Programming can be super intimidating at first. That’s okay. Everyone is a beginner at some point. Don’t forget that the “Masters” of this world have created many tools and allies for us to combat our inexperience.
This post originally appeared on Matthew Krey's blog. Read more on Medium.
Disclaimer: The information in this blog is current as of August 21, 2015. Current policies, offerings, procedures, and programs may differ.