At its core, data analysis is about drawing helpful conclusions and actionable insights through the collection and organization of data. The process involves several stages from exploring the data set, cleaning and transforming it, to then fitting it into appropriate models.
A data analyst uses several data analysis tools, such as Excel, SQL, and Tableau to help them with their daily data duties. But which of these do they need to know? Here are the top 25 data analysis tools data analysts should know.
Why are data analysis tools important?
Essentially, data analysis tools make the job of an analyst more efficient and productive. As a data analyst, you should be familiar with the data analysis tools that are available in order to choose the right tool for the business task. It’s more likely your company will have an established contract and you’ll have to get familiar with the tool that they are using.
Data analysts should always be learning in order to stay relevant in their career, and learning about emerging tools can help you stay on top of your industry.
But, there are many tools in the market. How should you select the best fit for your purpose?
How to choose a data analysis tool?
When choosing a data analysis tool, you will want to consider several factors, like:
- Data modeling capabilities
- Quality of data visualizations
- Ease of use
- Price
Above all, the features of the tool should be capable of producing results aligned with your organization’s needs.
Let’s look at these tools one by one and how they perform on these aforementioned diverse sets of parameters.
Top 25 data analysis tools on the market in 2021
1. Microsoft Power BI
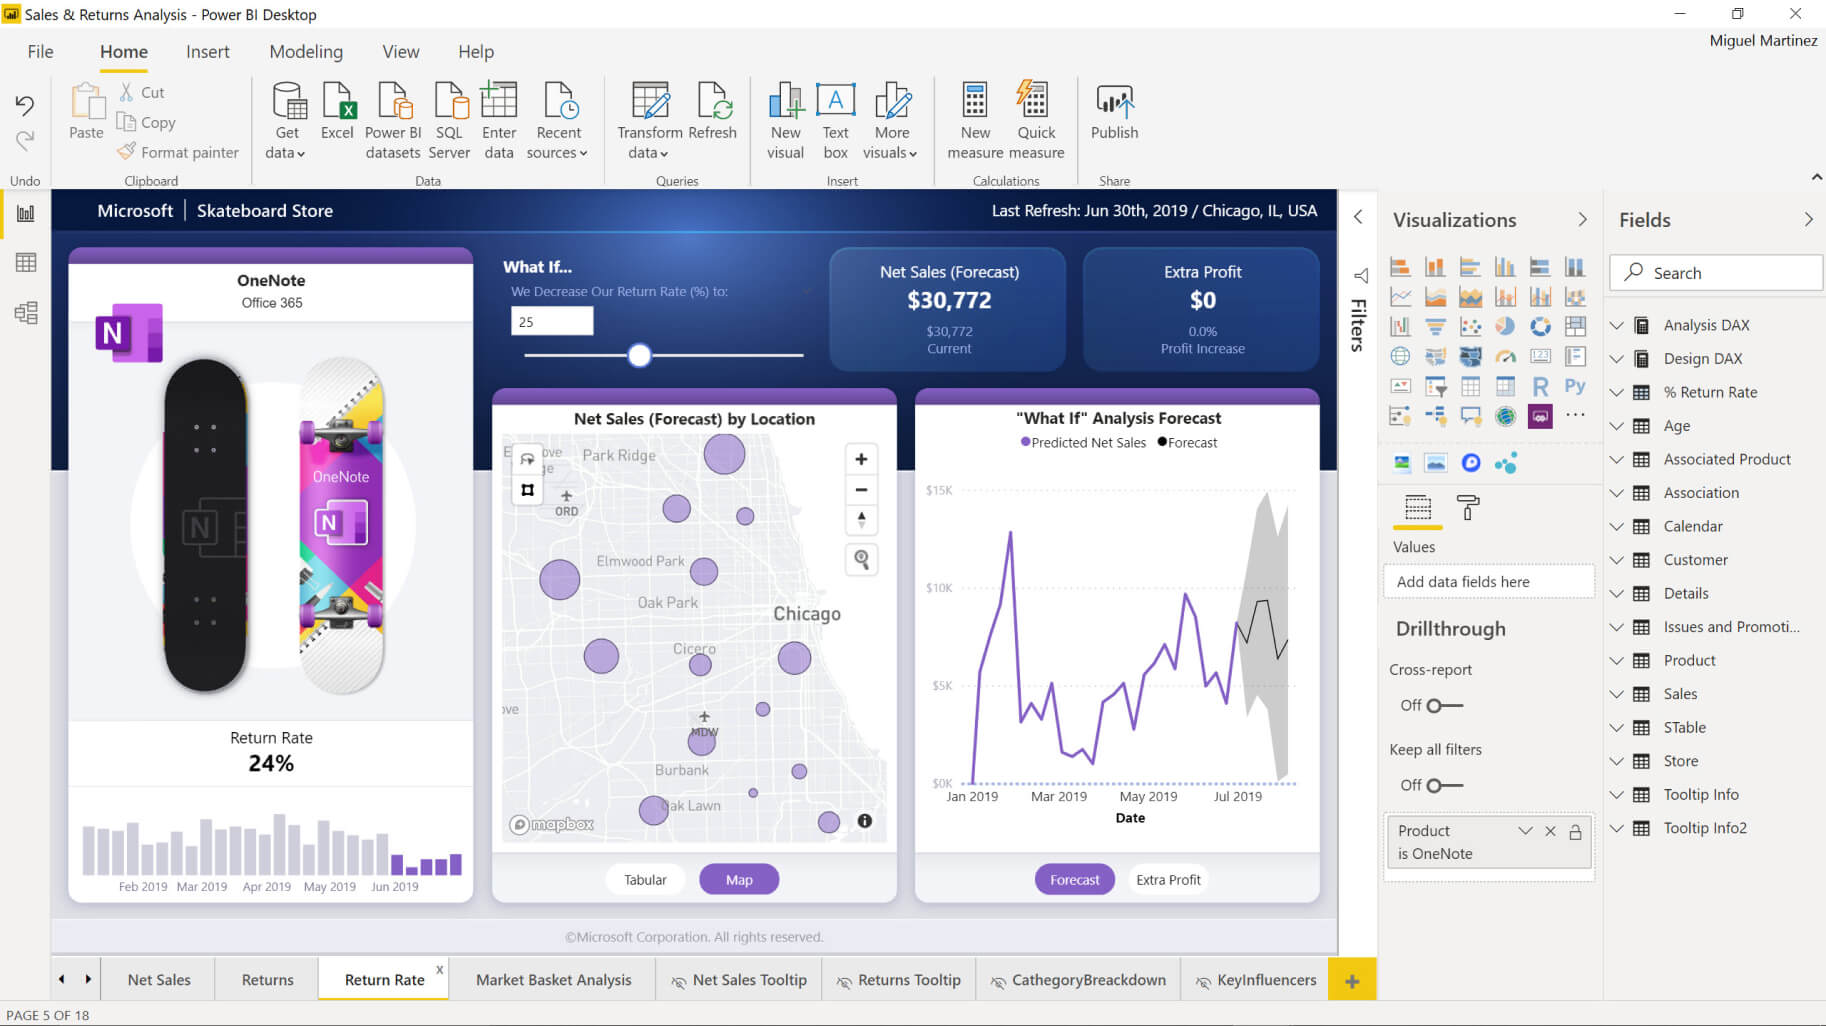
Image source: Microsoft Power BI
In Microsoft Power BI, you get self-service analytics at an enterprise scale. It uses smart tools to create data visualizations and comes with efficient excel integration, built-in AI capabilities, and pre-built and custom data connectors. Power BI Desktop is free to use and Power BI Pro is available for a low monthly price per user, making this a cost-effective tool for your company.
Microsoft Power BI helps keep your data safe with sensitivity labeling, end-to-end encryption, and real-time access monitoring. It helps accelerate big-data preparation with Azure. It also helps identify differences quickly, and you can move content from development and testing to production using visual cues in the deployment pipeline.
2. Tableau
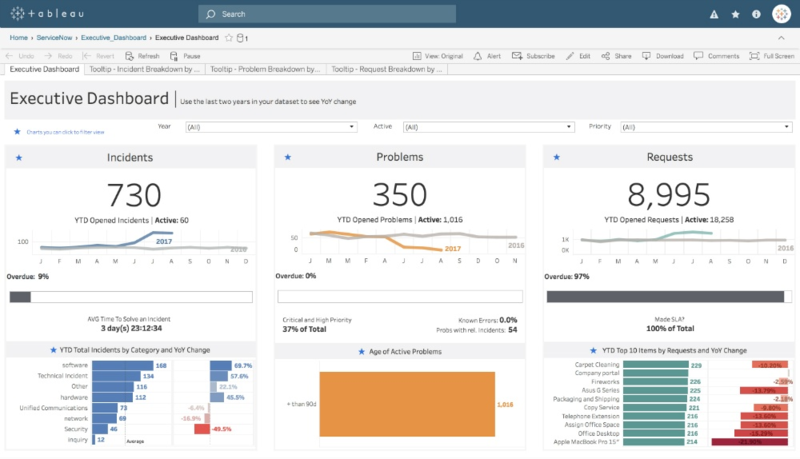
Image Source: Tableau
Often positioned as the ‘most beloved’ business analytics platform globally, Tableau empowers users with unlimited visual data explorations without compromising on the flow of analysis. The augmented analytics innovations of Tableau make life easier for data scientists as well as business users.
Tableau offers accessible machine learning, statistics, natural language, and smart-data prep features. You can analyze data in a quick, iterative way that allows you the scope of immediate feedback on the work you do. It is easy to deploy as you can comfortably connect its services to all of your data, no matter where it resides. With its enterprise-grade security, nuanced governance models, and powerful yet simple admin features, it is easy to scale with Tableau throughout the organization in a short span.
3. Jupyter Notebook
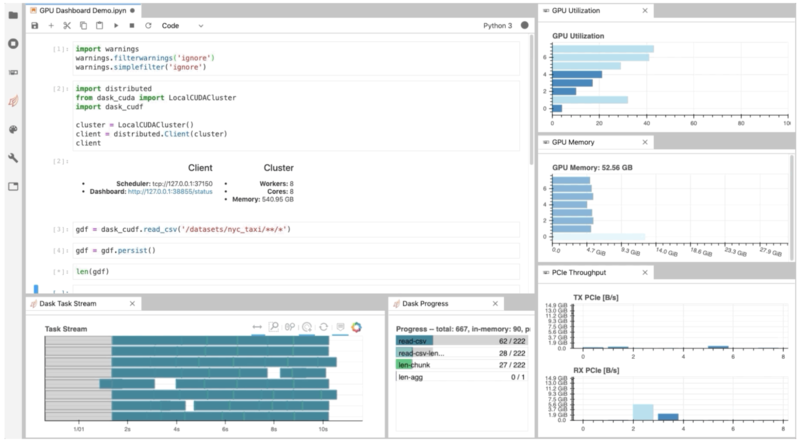
Image Source: Medium
Project Jupyter is a unique service aimed at developing open-source software, open standards, and services for interactive computing. It is compatible across dozens of programming languages. The Jupyter Notebook, as an open-source web application, allows you to create and share documents that might contain live code, equations, visualizations, and narrative text. There are several use cases of the notebook, including data cleaning and transformation, machine learning, and more.
The wide range of programming languages that the Notebook is compatible with includes Python, R, Julia, Scala, etc. You can share the notebooks using the simplest of sharing applications, such as email, DropBox, GitHub, or the native Jupyter Notebook Viewer service. The notebooks are JSON-based open document formats, communicating with computational Kernels using the ICP or Interactive Computing Protocol.
4. Qlik
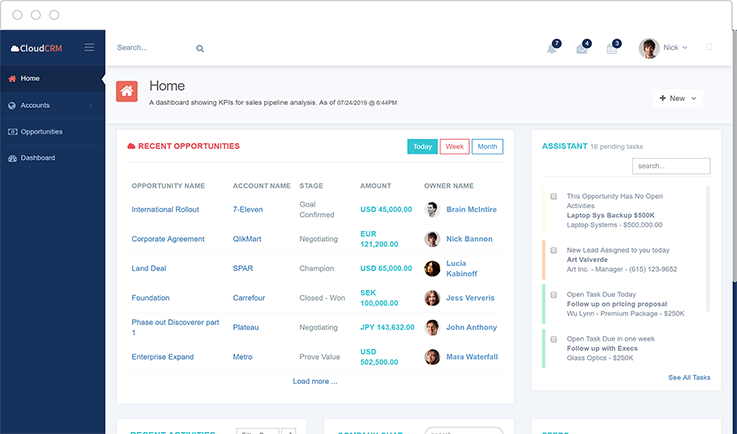
Image Source: Qlik
With the data integration platform of Qlik, you can move data in bulk and in real-time without impacting your source systems. Its data streaming features help deliver data to the cloud and beyond, with changes captured. Qlik allows you to automate the process of preparing analytics-ready data from raw datasets by helping automate your data warehouse or data lake without needing to use complex scripting.
With Qlik Catalog, you can offer trusted and governed access to all the data you want to allow your users to find and use. The Qlik Associative Engine Indexes help you discover every possible relationship your data might have. Qlik also has powerful AI features and allows embedding analytics directly into business processes and applications. The Qlik Support programs empower you with 24X7 enterprise-grade support.
5. SAP Business Objects
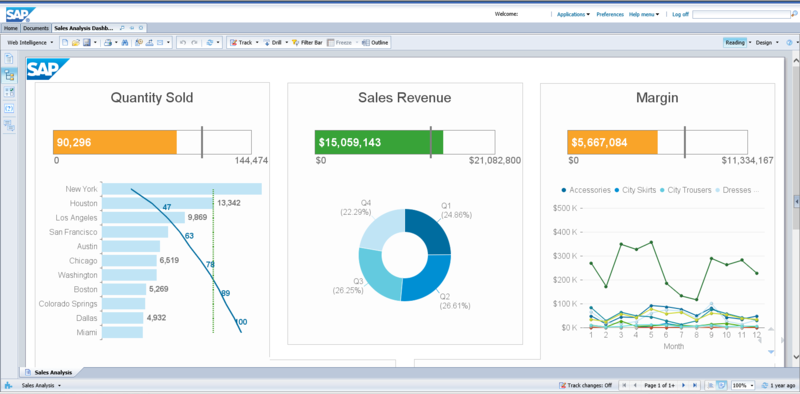
Image Source: Business Intelligence Software
SAP Business Objects’ reporting and analysis features help you find trends and locate root causes with ad-hoc queries and BI reporting. You can leverage its intuitive, self-service visualization tools to pack data, trend analysis, and story-telling into one. Its best-in-class sharing functionalities help you communicate your insights across your team and organization. You can also create role-based business intelligence dashboards to deliver information to decision-makers, anytime, anywhere.
You also get to leverage the strength of SAP. For instance, you can connect your SAP BO with SAP Business Warehouse and SAP HANA to power real-time analytics. You can discover in-depth business insights and forecast business drivers using Microsoft Excel. Its cross-platform sharing functionalities enable you to embed analyzed data into PowerPoint presentations.
6. SAS Business Intelligence
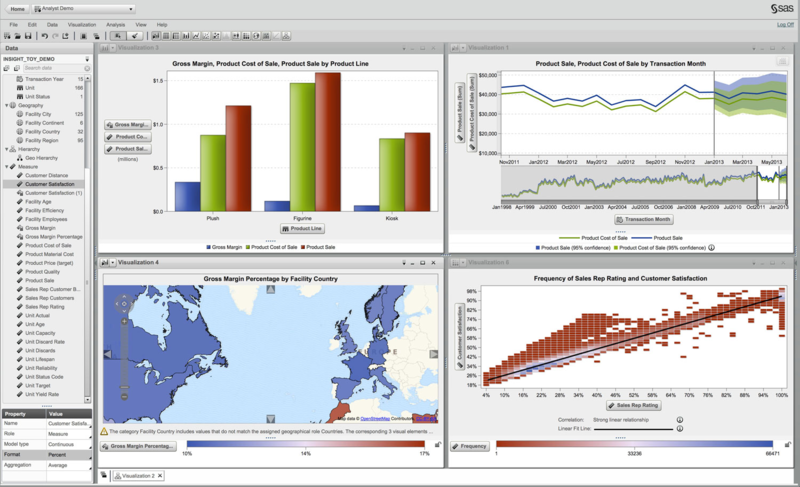
Image Source: SAS
The SAS business intelligence and analytics software helps you gain quick insights, using automated analysis backed by machine learning and easy-to-understand natural language explanations. With its easy-to-use analytics functionalities, you can conveniently spot correlations, point out exceptions, forecast trends, and predict outcomes. Without burdening your information technology team, you can create distribution-quality reports and analytics dashboards with SAS BI.
You can add SAS BI and analytics services to your MS Office applications, including MS Outlook and Excel. It also allows you to synchronize your SAS BI with native apps for the Windows 10, iOS, and Android platforms. The SAS SDK for iOS and SAS SDK for Android help create your customized apps which can be personalized with embedded SAS Visual Analytics content.
7. IBM Cognos
Image Source: IBM
Cognos Analytics from IBM helps you make prudent and efficient decisions with its automated data preparation, data discovery, and visualization features. With Cognos, not only can you import data directly from your CSV files and excel spreadsheets, but you can also link it to diverse cloud or on-premises data sources, including SQL databases, Google BigQuery, Amazon, Redshift, and more.
You can use its AI-assisted data preparation features to clean and prepare data from multiple sources, add calculated fields, join data, and create new tables. Cognos auto-generated visualizations features help create compelling and interactive dashboards. It also proves helpful in identifying patterns and creating dynamic and personalized multi-page reports. With the Cognos app, you can stay connected, access data, and get alerts from your mobile device 24/7.
8. Python
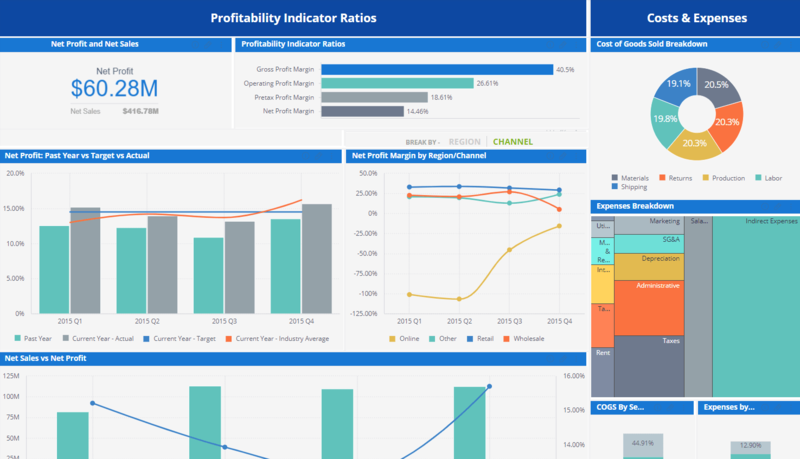
Image Source: Sisense
Although Python is a popular multi-purpose programming language, its analytics tools have grown popular due to its widespread adoption and versatility in developing multifaceted solutions. It has thousands of libraries dedicated to analytics, including the popularly used Python Data Analysis Library or Pandas. Pandas offers a host of tools to manipulate, analyze, and represent tabular data and complex datasets. Using Python, you can add deeper functionalities to your analytics suite than the other domain-specific languages which have narrow scope and functionality.
Python’s use of memory is light and it outperforms other analysis-oriented software like Matlab or R in this regard. You can use Python to build sophisticated models and perform simple, complex, and multivariate regressions. Using Python, you can write your data analysis algorithms and integrate them into your BI tools via API.
9. Oracle Analytics Cloud
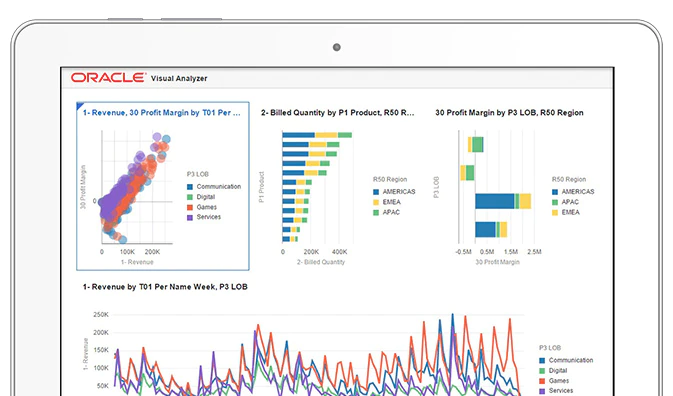
Image Source: Oracle
Apart from allowing businesses to access data from anywhere, Oracle Analytics Cloud also leverages its embedded machine learning features to discover unique insights faster with automation and intelligence. Its Natural Language Processing features help in visualising answers from conversational search and analysis. The machine-learning capabilities of Oracle Analytics Cloud combined with its predictive analytics features help build compelling visual data stories.
Oracle’s smart mobile solutions help you stay connected with automated insights and ongoing monitoring of business activities catering to query data in 28 languages. It sends alerts in real-time when new data or reports become available, numbers hit a threshold, or based on personal GPS location. It’s easy to share results and reports with Oracle Analytics across the team. You can also produce scheduled reports for your teams, staff, and customers.
10. Microsoft Excel
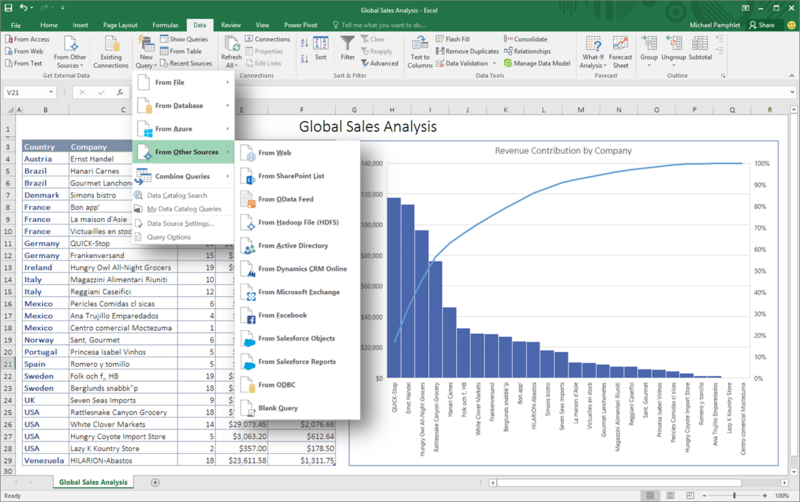
Image Source: Microsoft
MS Excel is one of the most used tools in business analytics. Along with newly introduced powerful visualization charts such as Treemap and Histogram, its popular 3D geospatial visualization functionalities help create 3D Maps. Its premium Power Query add-in features help connect to data from other CSV and Excel files, import data from public websites, access databases, OData feeds, and more. Excel has also introduced advanced analytics and modeling capabilities with Power Pivot.
You get extensive data modeling capabilities like Diagram View, KPIs, Hierarchies, and DAX Calculated Columns. The advanced collaboration features of Excel help you share your import and transformation queries with other analysts within your organization through a Corporate Data Catalog.
11. Apache Spark
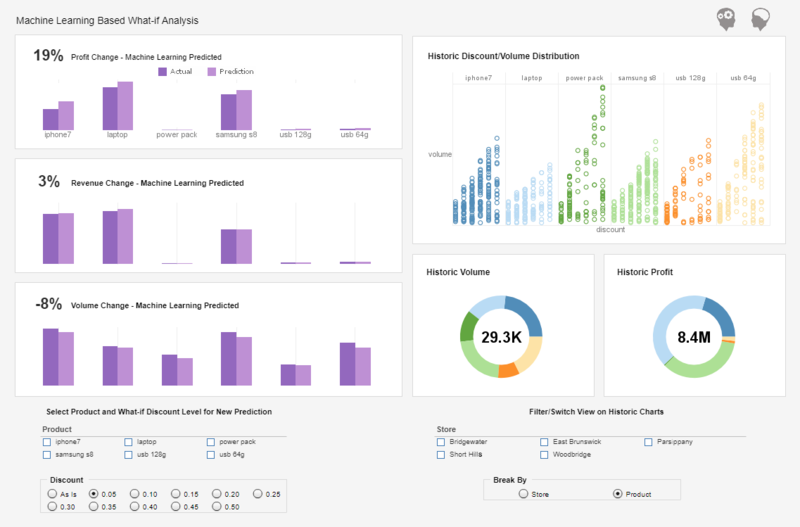
Image Source: Inetsoft
Apache Spark is a unified analytics engine to process large-scale data. Leveraging its state-of-the-art DAG scheduler, a query optimizer, and a physical execution engine, Apache Spark helps you run your workloads 100-times faster.
In Apache Spark, you can write applications quickly with Java, Scala, Python, R, and SQL. It offers a stack of libraries including SQL and DataFrames, MLlib for machine learning, GraphX, and Spark Streaming. Spark is almost universally compatible and runs on Hadoop, Apache Mesos, Kubernetes, standalone, or in the cloud.
12. Sisense
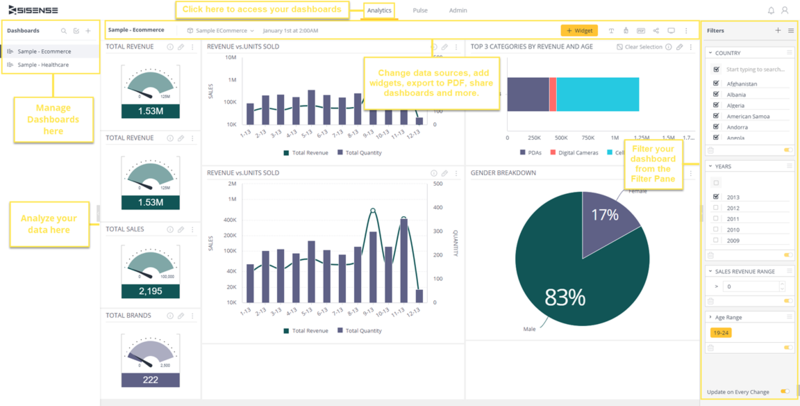
Image Source: Sisense
The analytics capabilities of Sisense cater to a wide range of industries, including enterprise, government, healthcare, supply chain, manufacturing, retail, software, digital marketing, and hospitality. It believes in delivering an infused analytics platform for the user to embed in the workflow, processes, business applications, and even products. To make it possible, Sisense has developed the most efficient set of APIs. Leveraging these APIs, one can create fully customized data experiences in any situation.
Sense-IQ is a unique knowledge graph technology deployed by Sisense, helping users make sense of data by getting to know its impacts and insights. The platform is usable by anyone and has something to offer everyone whether they know how to code or not.. It also offers agile solutions from one to multi-cloud, hybrid, or on-premise architecture.
13. TIBCO Spotfire
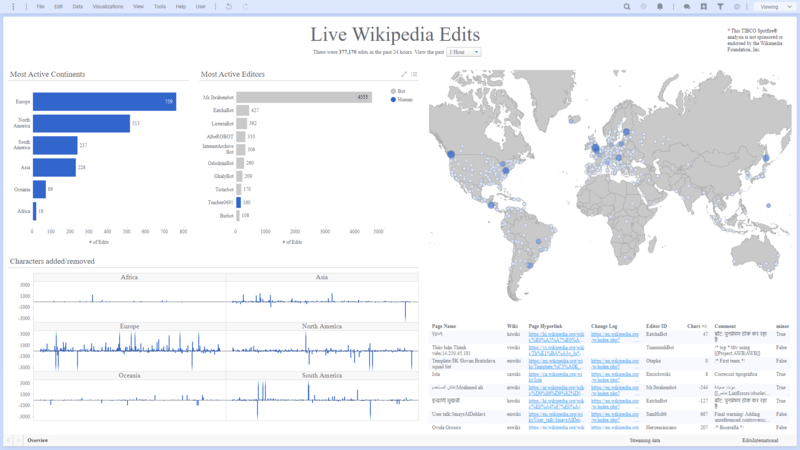
Image Source: TIBCO
The TIBCO Spotfire data visualization and analytics tool are enriched with multiple groundbreaking futures, including AI-based visual analytics, custom analytics app creation, trend prediction by combining the historic and streaming data, embedded analytics, and more. The latest version, TIBCO Spotfire 11, includes the most robust set of user-end features that it has had to offer so far. Its immersive dashboard helps users to quickly locate and ascertain new and emerging developments in the data. The tool also comes with Spotfire Mods to help you create customized analytics apps rapidly and repeatedly.
Leveraging the Spotfire embedded data science capabilities, you can write and manage scripts with R or Python, without having to change your environment. Another useful aspect of TIBCO Spotfire is that it helps you analyze all the data, including in-memory, in-DB, data streams, and the data-on-demand. To make the process happen Spotfire comes with more than 60 native connectors and innumerable custom connections through APIs.
14. Thoughtspot
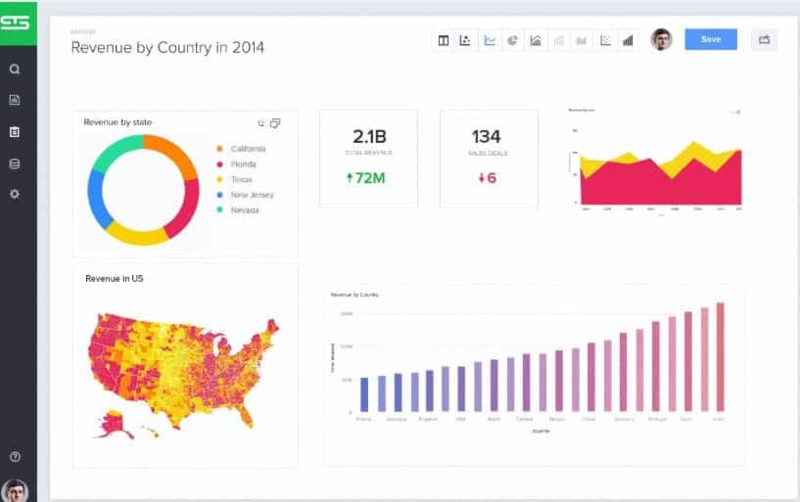
Image Source: Predictive Analytics Today
Thoughtspot helps you deploy the most innovative technologies from across the cloud ecosystem to bring out the best possible consumer-grade analytics offers possible. In that sense, it is one step ahead of search and AI-based analytics services. Connecting Thoughtspot to your cloud data warehouse, you can start writing live queries in minutes. The nature and quality of services do not vary depending on which end of the world you are accessing it from. Also, you can easily scale it up or down depending on the business demand.
Using Thoughtspot, you can also push your cloud data to your favorite apps. The frontline teams can access these data in real-time to make more prudent decisions. With Thoughtspot, you can auto-analyze billions of rows of data and spot anomalies or trends in the quickest time possible. Thoughtspot works with the assurance of best-in-class security and governance features with industry-leading cloud security and governance controls.
15. Google Data Studio
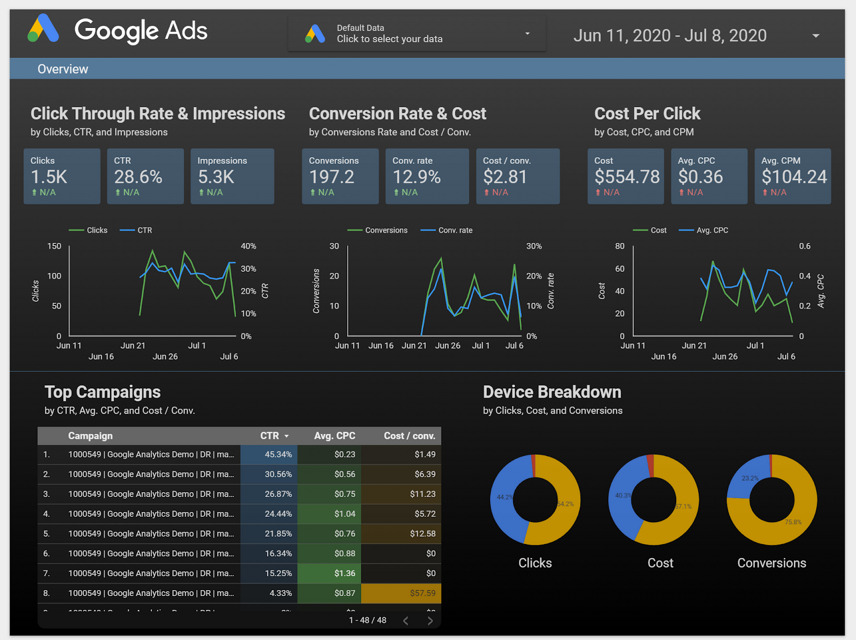
Image Source: Google Code Labs
Like many other Google solutions, Google Data Studio is a free-of-cost dashboarding solution. It allows anyone to perform advanced data analysis and visualization. Given the strength of Google’s collaboration network, the Data Studio makes it possible for you to connect with almost any type of data virtually.
The studio features best-in-class visualization tools from other developers and Google. Gantt Chart, Gauge, Radar Chart, Sunburst, etc., are some of the most widely used visualizations in the industry these days. You can also add your visualization tool to the gallery. Connecting these tools to your data is easy and convenient. You can access your data from more than 800 data sets from over 400 connectors.
16. Grafana
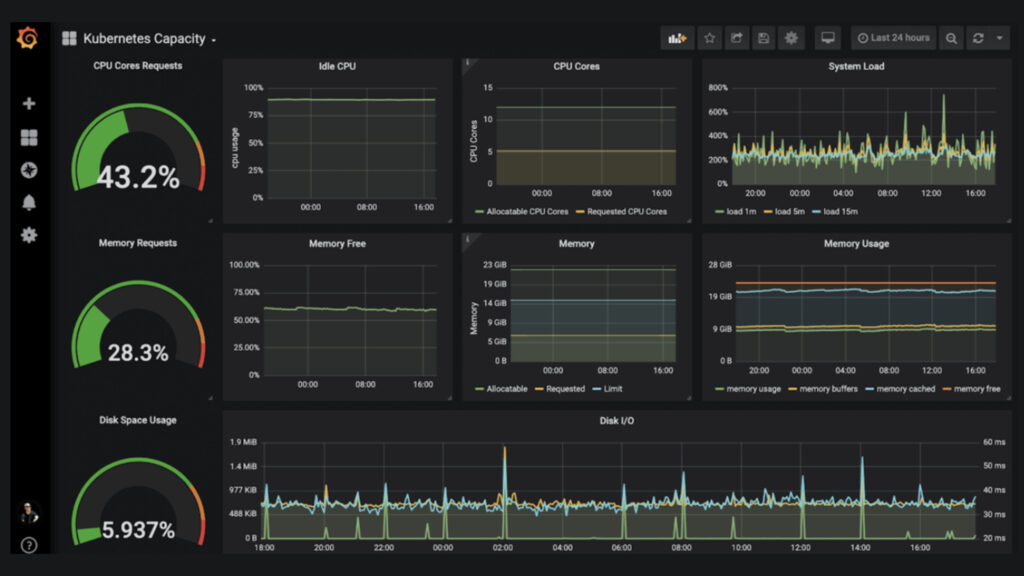
Image Source: Grafana
Grafana is the perfect tool to make the most of your metrics. It offers a wide variety of visualization tools for you to examine your data from the best angle possible. From heatmaps to histograms and from graphs to geo maps, Grafana has it all. You can define your thresholds visually, and Grafana will send you alerts whenever your data cross those thresholds. These alerts can come through Slack, PagerDuty, or something else.
Grafana is compatible with more than 30 databases, and what is even better is that you can combine any number of these databases on the same dashboard. Grafana is open-source, and you can conveniently integrate it to any platform you want. Its library has hundreds of dashboards and plugins.
17. Redash
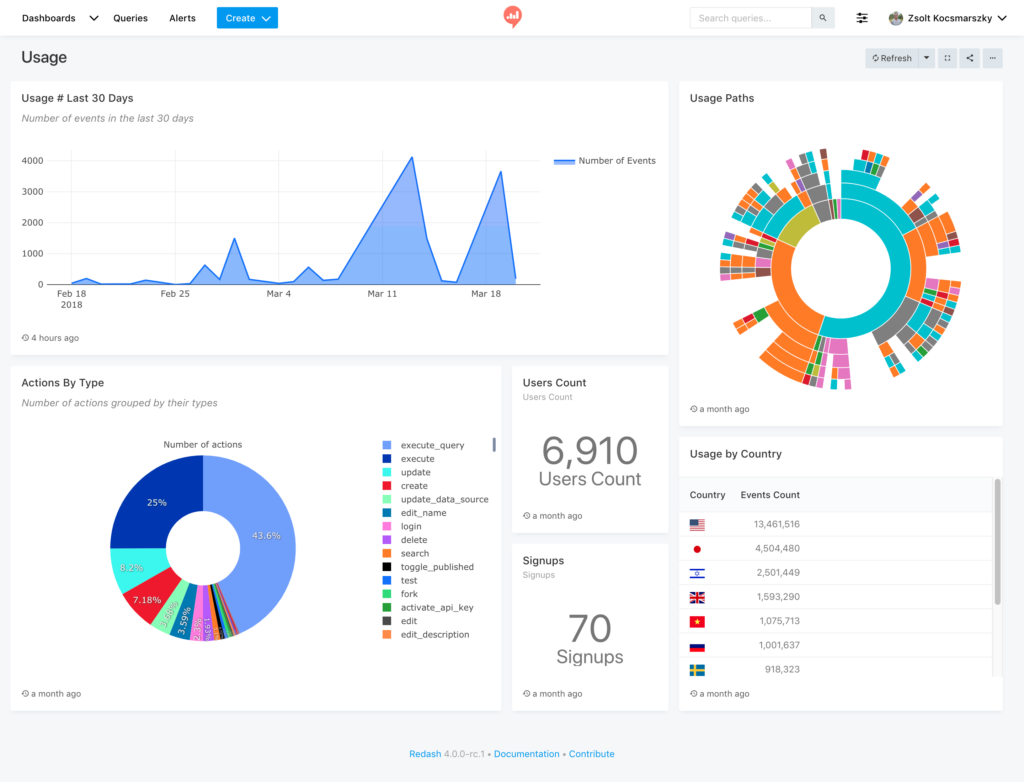
Image Source: Redash
The popular open-source project Redash helps you query your data sources. Additionally, you can build visual dashboards to represent the result and share it with your team. The strength of Redash lies in its versatility. You can query any data source using Redash. It supports SQL, NoSQL, Big Data, as well as API data sources. Redash SQL collaboration gives you access to a robust online SQL editor. You are also eligible to browse schema and click-to-insert. You can also create snippets and reuse them. Visualization on Redash is easy with its drag and drop editors.
18. Metabase
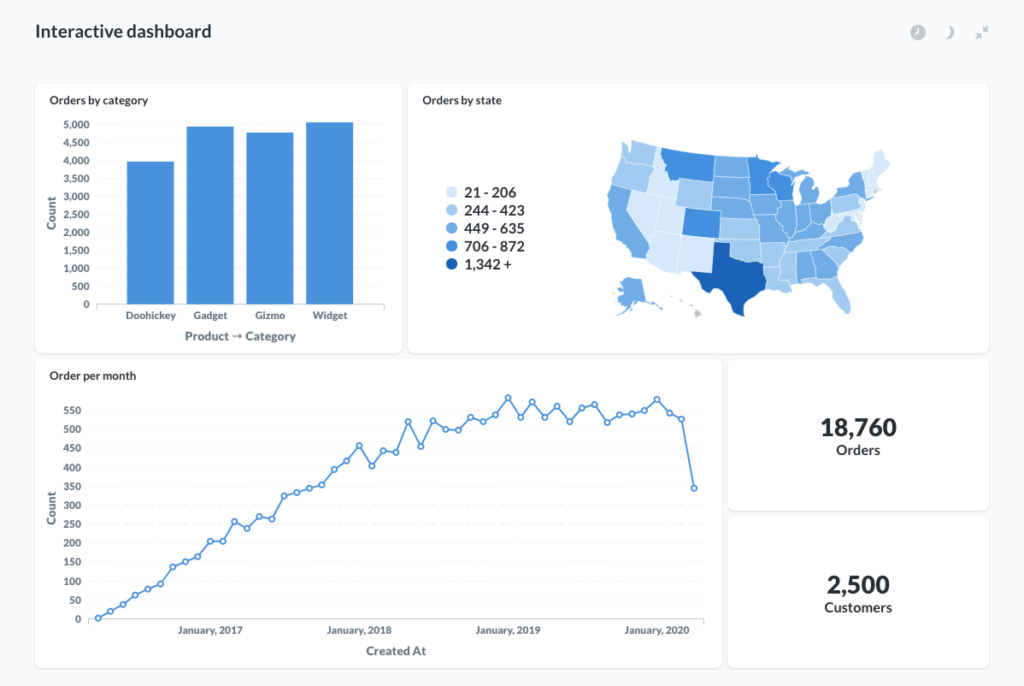
Image Source: Metabase
Using Metabase, an easy, open-source data exploration tool, you can get answers to your queries without having to mandatorily know SQL. All it requires are a few clicks to get answers from your data. However, for the more data-savvy analysts and answers to complicated questions, there is the scope of using SQL and Metabook’s notebook editor.
The notebook editor comprises visual joins, multiple aggregations, and filtering features to help you delve deeper into the data. With Metabase, you can also set up alerts and schedule your reports. The Metabase enterprise edition helps you with embedding analytics in your app. It is easy to set up and connect to your data before you start collaborating with your team.
19. Mode
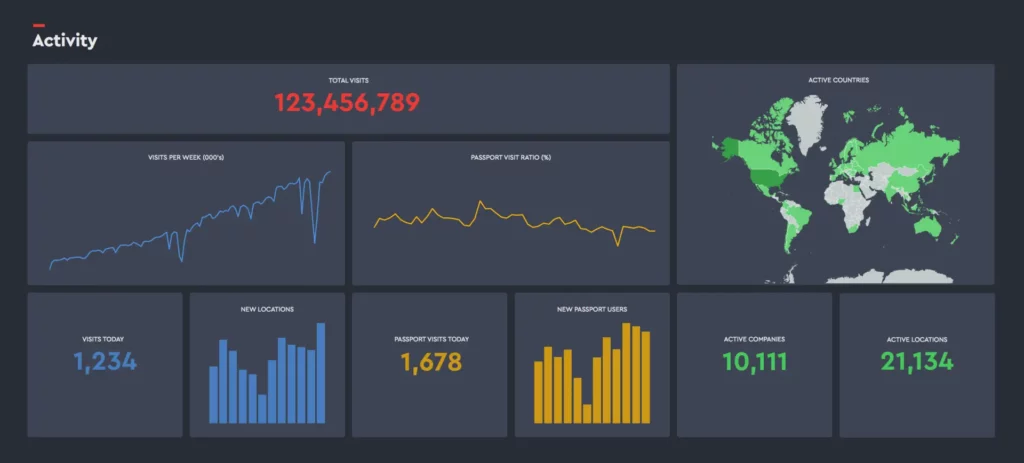
Image Source: Mode
Mode offers quick and exploratory, company-wide data analyses by combining the tenets of interactive data science with modern business intelligence. Data teams in your company can leverage Mode to run advanced analysis while smoothly changing gears between a cloud-based SQL Editor, Python & R notebooks. Finance teams can use the tool to leverage Mode’s visualization features, leading to quick anomaly detection. The operations team may explore Mode to monitor your infrastructure and speed up workflows.
The visual data exploration and drill-down features of Mode help your product team to identify interaction patterns between the user and the product. Finally, the sales and marketing teams can leverage Mode to repair the loopholes and improve the performance of your digital presence through event tracking integration and visual data exploration features.
20. KNIME
Image Source: Knime
KNIME focuses on automating financial analysis. It finds use in replacing manual data aggregation workflows in FP&A, Controlling, Treasury, Tax, Audit, and Compliance. You can start testing KNIME’s capabilities by looking at its budget monitoring reports, automated invoice checking, and accounting excel sheets. Once satisfied with these basic service offerings, you can start using KNIME to create replicable visual workflows and replace manual work with macro.
You can also automate your data cleansing and reporting processes with KNIME. Using KNIME BI tools, you can shape your data into the exact form you want. KNIME is perfect for your scaling-up needs. It supports unlimited users, rows, and functionalities. You can create as many free blueprints and custom solutions as you want. Through this one platform, you can collaborate with coders, finance experts, and businesses.
21. Looker
Image Source: Looker
Looker is a highly efficient modern business intelligence and analytics solution that empowers you with integrated insights, data-driven workflows, and custom applications. You can create real-time dashboards without compromising on the depth of your analysis. Moreover, Looker offers embedded analytics solutions, targeting retail, healthcare, and other industries. You can connect Looker with several databases, such as Redshift, Snowflake, and BigQuery. It supports more than 50 SQL dialects. It also supports hosting on cloud services like AWS and GCP.
22. RapidMiner
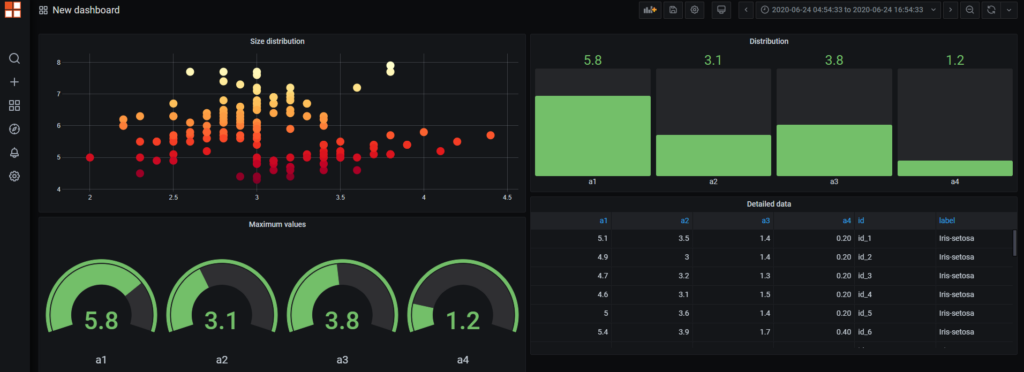
Image Source: RapidMiner
RapidMiner is a full-fledged data science platform with several solutions targeted at different layers of use-case scenarios. Using RapidMiner Go, you can create the best model for your business from only your business data sheet on Excel. The Studio version helps you with the entire workflow starting from data prep to model deployment. With its unlimited data rows, optimized performance & full automation with Turbo Prep, Auto Model, and Model Ops, the RapidMiner Studio is highly scalable and flexible. With a RapidMiner Educational License, you can access RapidMiner Studio along with RapidMiner AI Hub free.
23. Domo
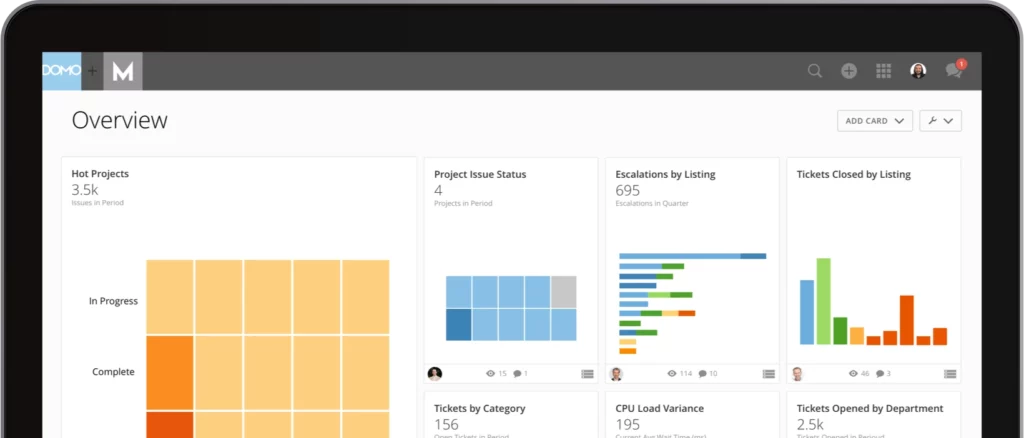
Image Source: Domo
Domo business cloud has gained traction in the recent past for its capability to offer a modern-day BI platform that is seamlessly compatible with any client technology. You can leverage Domo’s services if you want to quickly leverage your BI capabilities at a cloud scale. With its embedded analytics features, you can distribute data and analytics to your customers and partners. You can also improve your data utilization capabilities by enhancing your prevailing data warehouse and BI tools. You can build custom apps and automate data pipelines, using Domo.
24. Splunk
Image Source: Splunk
The event analytics and management features of Splunk helps you with intelligent event clustering, ITSM integrations, incident management, and more. It gathers data from multiple sources and enriches events with a single alerting framework. Its real-time, automated event correlation features trigger alerts, using policies powered by machine learning.
The incident management dashboard of Splunk can help you with the prioritization of addressable issues by severity. Its scalable and highly advanced features help monitor, detect, investigate and react to threats with a cloud-based, analytics-driven SIEM. You can use Splunk to improve your security operations by accessing its risk-based alerting services and leveraging investigative tools for fast response.
25. Apache Storm
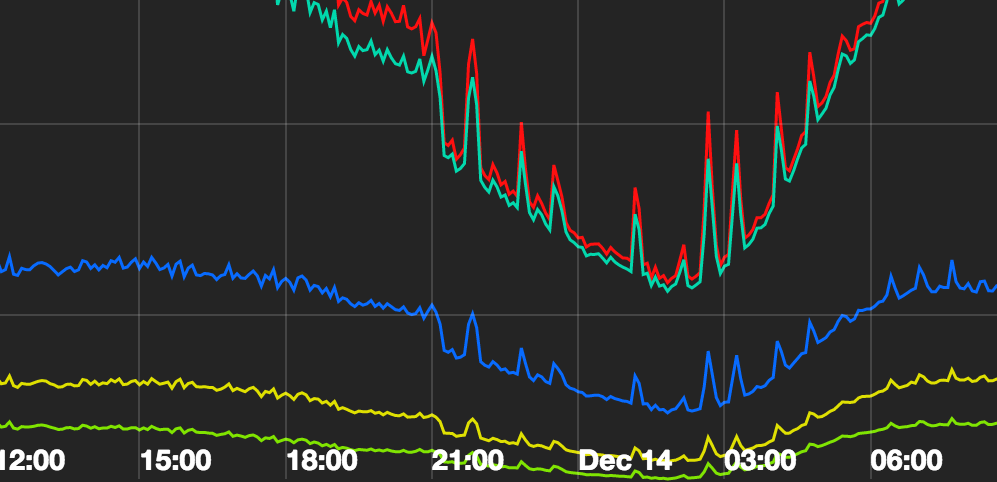
Image Source: Spotify
It is a free and open-source distributed real-time computation system. Using Apache Storm, you can process unbounded streams of data. Moreover, you can use it with any programming language. Analysts leverage Apache Storm for real-time analytics, online machine learning, continuous computation, distributed RPC, ETL, and many sophisticated operations. It is an easy-to-setup tool. It is also convenient to scale up, with a high level of fault tolerance. The Apache Storm topology allows you to integrate it with the queueing and database technologies you already use.
FAQs
Is it hard to get a data analyst job?
A report by the US Bureau of Labour Statistics estimates that the rise of data science needs will create roughly 11.5 million job openings by 2026. The World Economic Forum expects data scientists and analysts to become the number one emerging job role in the world in 2022. To make yourself eligible for these roles, you need to be well-versed in data cleaning, preparation, exploration, and analysis techniques. You should also have the required statistical knowledge and aptitude for visualizing data and solving problems.
What are the two types of data?
There are two types of data: qualitative and quantitative. As their name indicates, qualitative data is information about qualities that you can’t count and quantitative data is information that you can measure.Image aImmIs SQL a data analysis tool?
Used for data analysis exercises, SQL or Structured Query Language is a domain-specific programming language used to design and manage data held in a relational database management system, or for stream processing in a relational data stream management system.
What are the top 3 skills for a data analyst?
- The fundamental knowledge of data structures and algorithms and understanding of statistical languages, such as Python and R.
- Knowledge of prominent data visualization tools
- Knowledge of data analysis methods such as descriptive statistics and inferential statistics
What are the basic data analyitcs tools?
The basic data analytics tools are Excel, SQL, Tableau.
Thinking about a career in data science or want to level up your knowledge of data analysis? Flatiron School’s Data Science bootcamp has full-time and flexible pacing options so you can learn data analysis and engineering, scientific computing and quantitative methods, and machine learning, at a pace that works for you.
You can also download the syllabus to understand what topics will be covered in the course. Apply now or schedule a 10-minute chat with the admissions team.