For millions of Americans, the third month of the year means only one thing – March Madness. With more than 70 million official brackets created annually, the likelihood of your bracket being correct is slim.
Here’s Data Science Curriculum Developer Brendan Purdy on how he uses Machine Learning to make predictions and beat the odds.
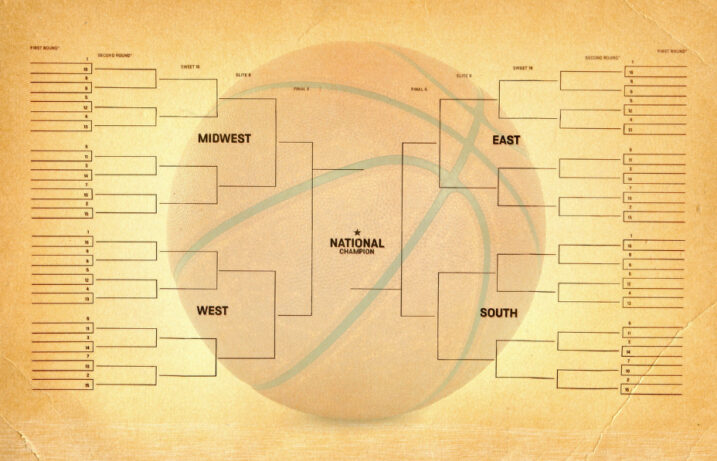
The Tournament
First things first, we’ll do a short overview of what the March Madness tournament is for those not familiar with all things Basketball, or who just need a refresher.
The NCAA Division I men’s basketball tournament is a single-elimination tournament of 68 teams that compete in seven rounds for the national championship. The playoff tournament is known as “March Madness” due to there being 67 games in the single-elimination tournament within three weeks, many of which overlap and are played simultaneously in the beginning. The winner of the tournament is crowned the NCAA Basketball Champion for the season.
Creating Brackets
Individuals pick who they think will win each game. Millions of fans submit their brackets for online competitions that have payoffs. Over 40 million people fill in brackets, many people more than one, which results in over 70 million officially submitted brackets. The actual number of brackets created each year is likely much higher, considering that many will simply make their own and never share or submit publicly.
To complicate matters, there is a “Round 0” of the tournament called the “First Four” where 8 teams play for four spots in Round 1. Round 1 has 64 teams.
The process of creating a bracket is to select the team you think will win each match-up. As the tournament proceeds, your choices narrow down until the championship game.
This article will cover the men’s tournament, however, two March Madness tournaments run simultaneously – a men’s and a women’s. Everything that’s covered in this piece data-science-wise can be applied to both.
By the numbers:
- 9.2 quintillion – With 63 games from Round 0 on, there are 2^63 = 9,223,372,036,854,775,808 possible outcomes for a bracket
- 49 – The longest (verifiable) streak of an NCAA men’s bracket is 49 games, where the person predicted all of the teams who got into the Sweet 16 in 2022
- $3.1 billion – About 45 million Americans wagered a total of 3.1 billion dollars on March Madness games in 2022
With billions of dollars wagered each year on statistically slim odds of winning, why not use Data Science to make better predictions?
Data Science
The goal of Data Science is to discover actionable insights hidden in large data sets by creating models using the tools of mathematics and statistics and machine learning, along with germane subject matter expertise.
Let’s break those ingredients down a bit more to see how they all work together to make predictions.
- Mathematics and statistics – Math and stats give the foundations of machine learning algorithms and inform us how we can interpret the models.
- Machine learning – Machine learning is artificial intelligence algorithms that learn from data.
- SME – The data is always about a specific thing, and this is where the subject matter expertise (SME) is germane. Having SME aids you in accurately interpreting data to produce relevant insights.
Now, what skills will you need to create a powerful predictive model to beat the March Madness bracket odds? The main fundamentals the typical data scientist would use to create a model like this one are:
- Math and stats – Calculus, Linear Algebra, Statistics, Probability
- Programming/software skills – Python, Tableau, SQL, R/R Studio
- Other skills – SME, Communicating and storytelling with data, Data ethics, and privacy
If you don’t have all of those skills – worry not! You can still read about how the modeling works using machine learning below, courtesy of Flation School Data Science Curriculum Developer, Brendan Purdy. Or if you want to try your hand at Data Science, jump into our Free Data Science Prep Work!
Machine Learning
Next, we’ll learn a bit about Machine Learning – how it works, its goals, and common examples.
Machine Learning is often defined as “a subfield of Artificial Intelligence where the algorithms learn from data.” That’s the key – that the algorithm learns from data, instead of just delivering preset and easily-definable outputs as a calculator does. For example, programmers initially programmed AI to play games like checkers and chess and inputted all the rules so that if an opponent did an action, the program would perform an expected response action. However, with modern AI, the system has enough computational power to learn from the data and perform new, nonprogrammed actions, making it machine learning.
Types of Machine Learning
There are two main types of machine learning – supervised and unsupervised.
In supervised machine learning, algorithms are trained using labeled data, e.g. linear models, nearest neighbors, decision trees, and gradient-boosting decision trees. The programmer tells the AI what the data means, and then asks the AI to look at similar data and determine what it is. For example, define an image as a picture of a cat, then show another image and ask the AI if the image is of a cat or not.
In unsupervised machine learning, algorithms are used against data that is not labeled, e.g. Gaussian mixture models, and clustering algorithms. For example, give the AI pictures of various animals, and ask how the machine would group them.
Common Goals of Machine Learning
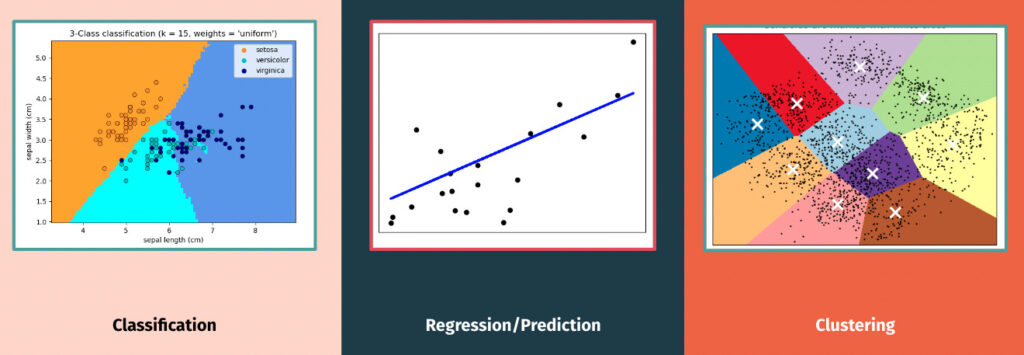
Classification – a type of supervised learning. In this type of program, you give the program attributes to group items based on.
Regression/Prediction – a type of supervised learning. This is the type of model that we will use to create our March Madness Bracket. The most basic example of this is our linear regression model, with a line that represents trends in the data.
Clustering – a type of unsupervised learning. In this case, the machine puts data into clusters. This model type is used to make inferences from demographic data for companies. For example, if you are part of a rewards program, these types of models gather data based on your purchases, then use clustering machine learning to attribute you to a certain demographic and inform targeted advertising campaigns.
Machine Learning Usage In Industry
Whether you realize it or not, machine learning permeates much of your daily life. According to industry surveys, 67% of companies were using machine learning in 2020. 97% planned to use it in 2021.
Some examples of machine learning that you likely interface with, or interfaces with you and your data, almost every day:
- Recommendation systems (Netflix, Amazon)
- Neural Networks (sports analytics)
- CNN (medical image analysis)
- NLP (Translations, Chatbots)
- Clustering models (demographics of customers)
The applications for machine learning are numerous and growing each year. Knowing how to wield such a powerful tool can set you up for success in far more than just your friend’s March Madness bracket.
Extreme Gradient Boosting
Now that we know a bit more about machine learning, which algorithm are we going to use for our bracket predictions? For making a March Madness prediction, we will be using a decision tree.
Decision Trees are a supervised learning method. The goal is to create a model that predicts the value of a target variable by learning simple decision rules inferred from the data. They can be used for classification or prediction.
A decision tree takes in data and determines the probability of the most likely outcome.
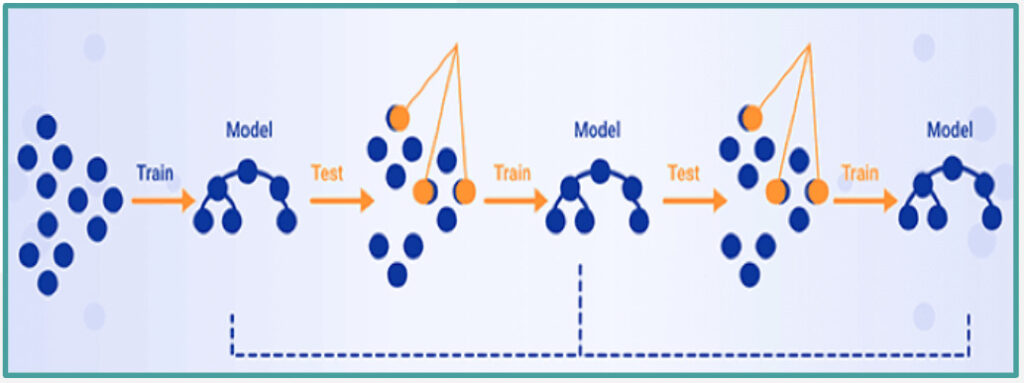
For the specific decision tree type, we will be using a Gradient Boosting Decision Tree (GBDT). A GBDT uses boosting to create many decision trees iteratively. It uses weak learning to calculate the gradient to minimize the error for each iteration of the algorithm. The model makes the prediction based on a weighted aggregation of each input. The algorithm also calculates a gradient to minimize errors for each iteration.
How Boosting Decision Trees Work
Some facts about Boosting Decision Trees to further explain how the model works:
- Ensemble Method – In machine learning, an ensemble method combines more than one technique. Boosting is a type of ensemble learning that uses many decision trees. Ensembles often work better than a singular model as they’re able to exploit multiple algorithms at the same time.
- Weak Learner – A weak learner is a model that only does slightly better than random chance. This results in a simple decision tree.
- Iterative – One tree is created and then the algorithm determines what the weak learner got wrong. It then builds another weak learner that focuses on what the previous tree got wrong. This process continues until a stopping condition has been met.
- Aggregate Predictions – Boosting algorithms make the final prediction based on a weighted aggregation of each input. The inputs that were harder for the weak learners to learn are weighted higher than those that were easy to learn.
Minimizing Errors
As mentioned above, gradient boosting is used to minimize the errors in each iteration created. Here’s how the model does this:
- Residual Fitting – A residual is how far the actual value is from the predicted value. GBDT uses the residuals with a loss function to see how well, or poorly, it is doing.
- Loss Function – A loss function uses the residuals of the model to calculate the overall loss. (The loss function must be differentiable.)
- Gradient Descent – The gradient is a concept from calculus that is used in a myriad of machine learning models. The key idea of the gradient descent is that it uses the second derivative of the loss function to determine how to minimize loss, i.e. error. This is what GBDT is using at each iteration of its algorithm.
All three of these concepts tie together. The residual fitting is the input into the function. The loss function is the function itself, and the gradient descent is the second derivative of the function.
XGBoost & Bracket Prediction
So how do we implement this Gradient Boosting Decision Tree to make March Madness predictions? By using XG Boost.
Data Set
Everything starts with acquiring data. The NCAA and Kaggle release several data sets that contain for each team: historical seeding, performance (both season and postseason), box scores, geography, coaches, etc. Five thirty eight and other websites also have a ranking of the teams.
Preprocessing/ Feature Engineering
This is often the most challenging aspect of machine learning: bringing disparate data sets together, getting the variables in the proper form so that we can use the algorithm, etc.
Preprocessing is prepping the data, and feature engineering is focusing on certain variables. Once this is complete, you move on to XG boost.
XG Boost
XGBoost is the most commonly used library for GBDT and is available in a large number of languages, including Python. Part of where the science of data science comes in is at this point when the data scientist needs to “tune” the model. If two data scientists used the same data sets and did the same preprocessing and feature engineering, modifying the model’s parameters (aka “tuning” it) differently will result in different outputs.
Predictions
In a single-elimination tournament with 68 teams, we predict (68*67)/2 = 2,278 matchups and get the probability of who is more likely to win each possible match-up.
Sample Output
The predictions represent the probability that the team with the lower id will beat the team with the higher id, e.g. 1101 has a 2.7% chance of beating 1104.
Measuring Success
So once you have your bracket, how do you measure success? We’ll consider two ways how well we did.
Bracket Challenges
For sites like CBS Sports, ESPN, etc., typically a weighted value is given for each game where you have a correct pick, e.g. 1st round is 1 pt, 2nd is 2 pts, Sweet 16 is 4 pts, Elite 8 is 8 pts, Final 4 is 16 points, Championship is 32 pts. The highest score at the end is considered the “winner.”
Machine Learning Competitions
For ML competitions like Kaggle where the goal is to use ML modeling, then a metric like log-loss is used. Log-loss is indicative of how close the prediction probability is to the corresponding actual value (win or loss). In particular, this provides extreme penalties for being both confident and wrong.
Brendan Purdy’s Bracket Predictions
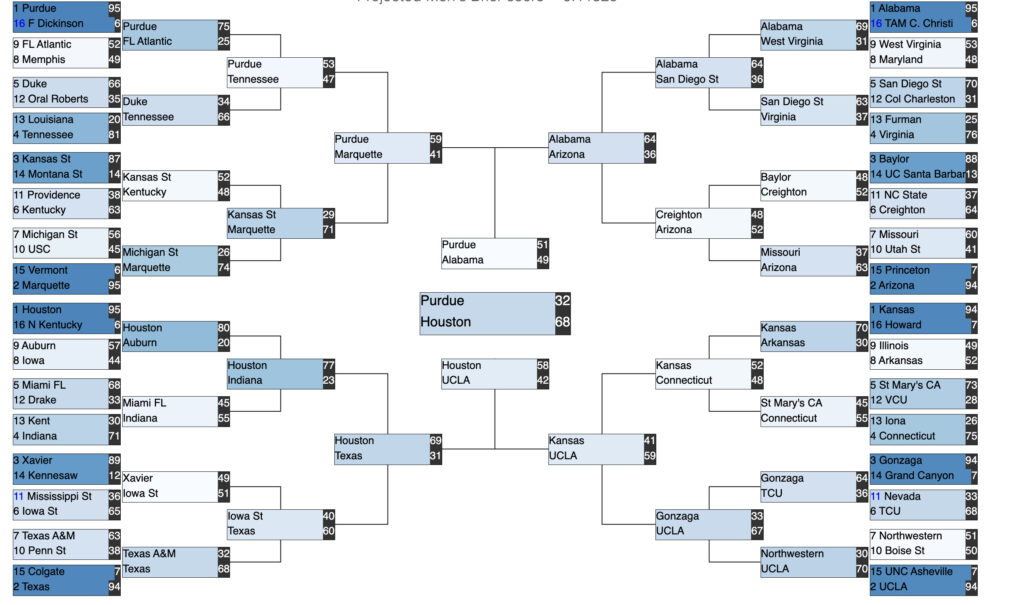
Here’s Brendan’s March Madness bracket, based on his Machine Learning model (though he notes, as a long-time UCLA fan, that he does not approve of Houston beating UCLA, no matter what the algorithm data says.)
Come back in mid-April to see how he did, with a follow-up piece explaining model predictions vs. real-life results.