
Eric Au, an August 2022 Data Science graduate from Flatiron School, combined his love of sports and machine learning to create his capstone project.
In his project “Stepping Up To The Plate”, Eric used machine learning to predict MLB player salaries and team wins. Watch his full presentation below:

Stepping up to the Plate – Major League Baseball and Machine Learning by Eric Au
If you’re a sports fan or a fan of the movie Moneyball, you know that an issue teams face is how they spend and allocate money when it comes to building a team.
The core subject in Moneyball was how smaller market teams such as the Oakland Athletics can compete with larger market teams like New York and Boston who can spend much more money. For my capstone project, I wanted to explore that and try to predict the MLB player salary of pitchers and batters using historical baseball data. Secondly, I wanted to better understand what statistics contributed the most to winning when it comes down to predicting team wins.
Data Set
The data set for this project consisted of historical baseball statistics and advanced statistics.
In 2014 Major League Baseball introduced Stat Cast which allowed teams to collect more baseball data than ever before. This included detailed statistics such as how hard the ball was hit, how many revolutions per minute the ball spun, and many others.
The key takeaway here is that advanced statistics have far more features or variables to work with.
Taking a look at the data set that I worked with, we see some of the highest-paid players in baseball. This gives you a good perspective of some of the top Echelon of stars in the game as of 2021, as some of the top players are making in the tens of millions of dollars. I considered most of these players as outliers.
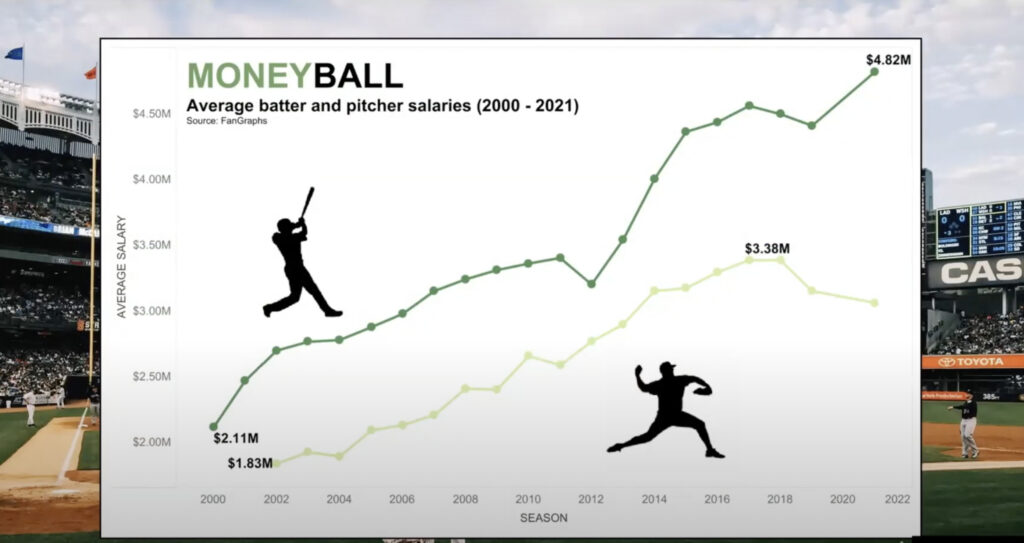
However, since 2000 I noticed that the average batter and pitcher make far less than the outlier group. Batters are more recently making about $5 million on average compared to the pitcher making about a million less.
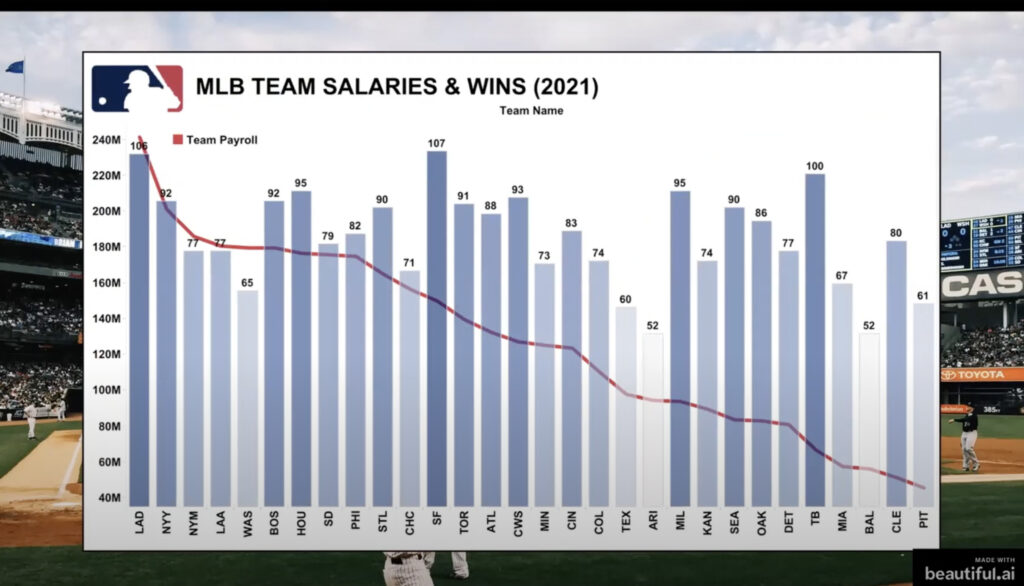
As I mentioned Major League Baseball has incorporated data analytics more. When taking a look at team salaries and wins during the 2021 season we can discern some noticeable observations. We especially see data analytics used heavily for teams like the Tampa Bay Rays who are on the far right with 100 wins and the Milwaukee Brewers directly adjacent to that with 95 wins.
Ultimately these are two example teams that have a smaller relative payroll than some of the bigger M\market teams like the LA Dodgers or the New York Yankees.
Predictive Results
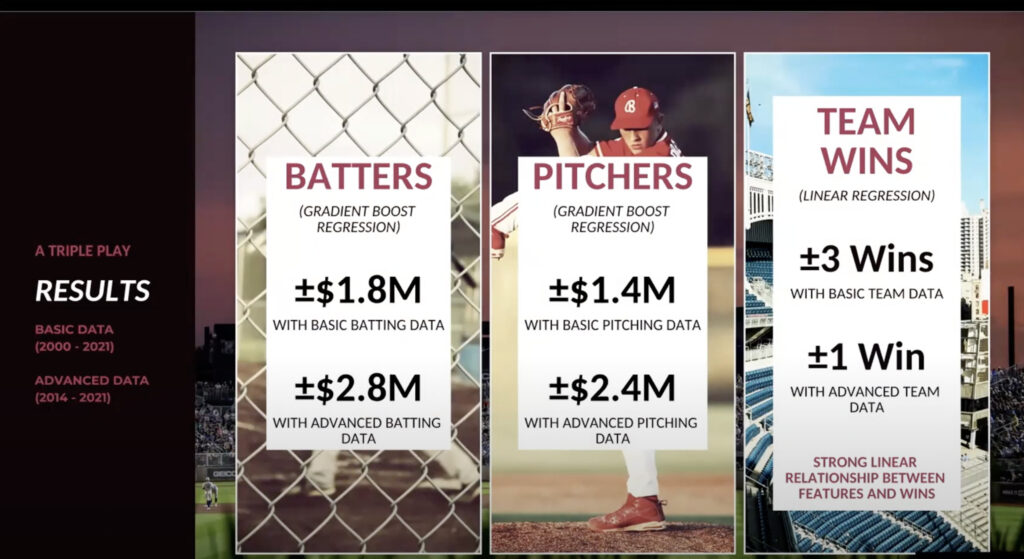
In terms of results for my predictive model, I achieved a margin of error of under $2 million. For Advanced Data the margin of error was about $2.8 million and $2.4 million for batters and pitchers respectively. The reason for the different margins of error is due to the different sizes of the data sets. When predicting team wins per season this was a fairly simple linear regression model where I was able to achieve a margin of error of one win using Advanced team data. This indicates that there’s a strong relationship between features and wins.
Model Web Application
I also want to show this application that I made. I used streamlit to develop a pair of locally run applications. They take in user input and provide a salary prediction for pitchers and batters.
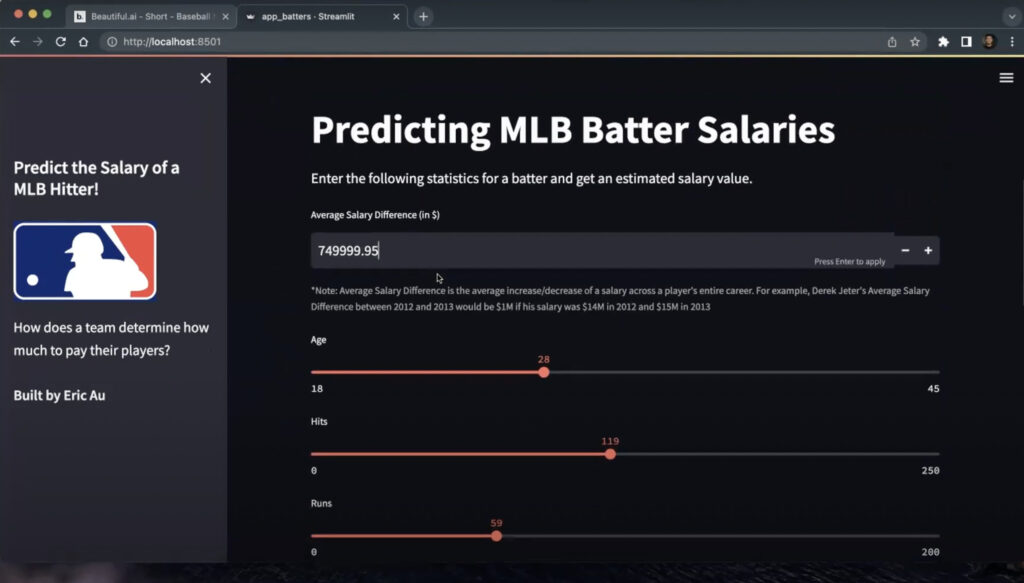
For example, this first input is $750,000, which is the average salary difference across a player’s career. This gives you a little of how that was feature engineered. Ultimately, you can shift around some of these values for batters. You can do whatever you want, you can make whatever player you’d like to make for this previous season. Then, hit submit and it gives you a predicted player salary of $3.8 million.
Hopefully, you can afford that if you’re building your team.
Comparing Model To Season Statistics
Another thing I looked at while working on this project was how it compares to this season’s statistics and how much money players this year might be making as of August 24th, which is when I loaded this data set. If you’re familiar with the game of baseball, one player that’s doing exceptionally well this year is Aaron Judge. He plays for the New York Yankees. He’s recently made $90 million this year; my model is predicting he makes $21 million as of August 24th. One could argue that’s still underpaid. But based on the season statistics alone you’ll know if a player is overvalued or undervalued.
Technology Used
In terms of the technologies that I was using, the main language was Python. It Incorporated the scikit-learn library to apply those machine learning techniques for this project. Visualizations were developed using Tableau Software and the web application was deployed through streamlit. All the data was sourced using the pybaseball library and FanGraphs.
Notable Challenges
There were a few notable challenges I encountered when working on this project. One was narrowing down the many features to the most important features that gave me the best predictions. As I discussed, there were many features to work with. But, simpler model models are generally preferred since they are easier to interpret and understand. This is where domain knowledge about baseball especially helped in identifying those important features. Additionally, reducing the margin of error for predictions was especially difficult. This was because there are those Superstar players who are making well above the average salary. There are other factors that are not necessarily explained in baseball statistics alone that can account for a player’s salary such as basic economic demand for a player in a particular off-season.
Want To Try Your Hand At Machine Learning?
Eric Au was a civil engineer that enrolled in Flatiron School’s Data Science course to change careers. He created this project as his capstone project, using all of the skills he’d learned during the program.
Think that sounds interesting? Try your hand at Data Science with our Free Prep Work and start learning how to make a machine learning project just like Eric’s today.